| Frame | Nreads | Zeropoints | Mag plots
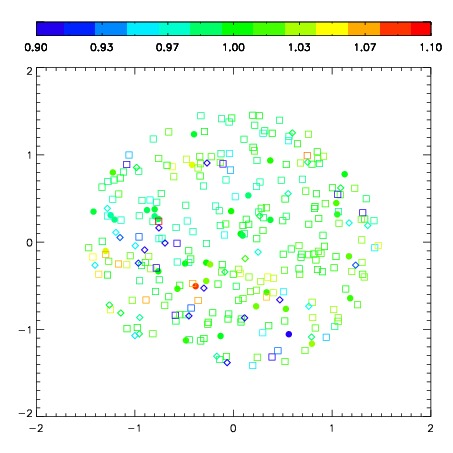
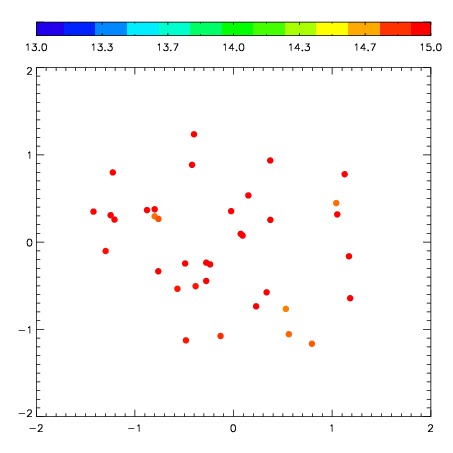
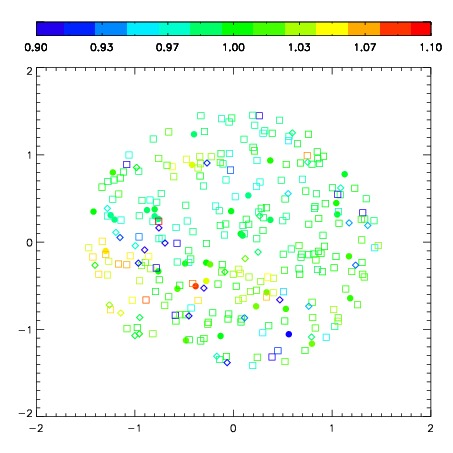
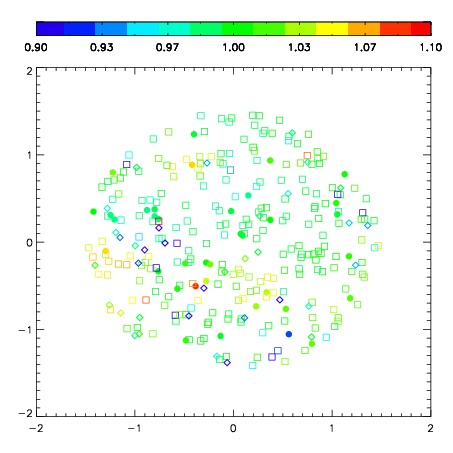
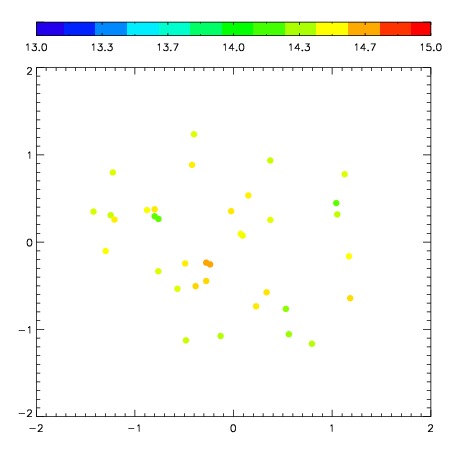
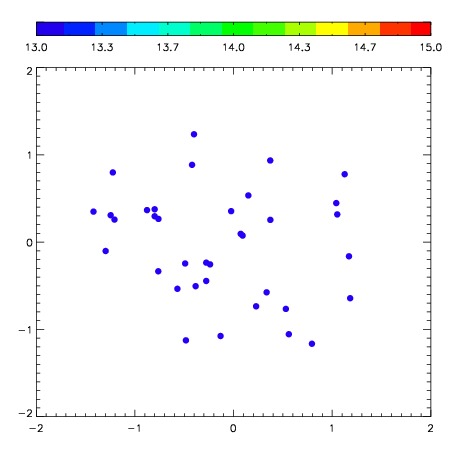
| Spatial mag deviation
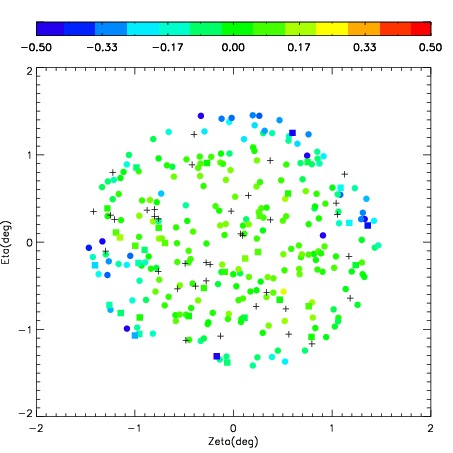
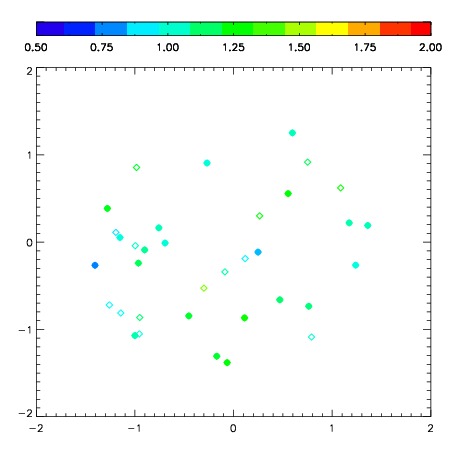
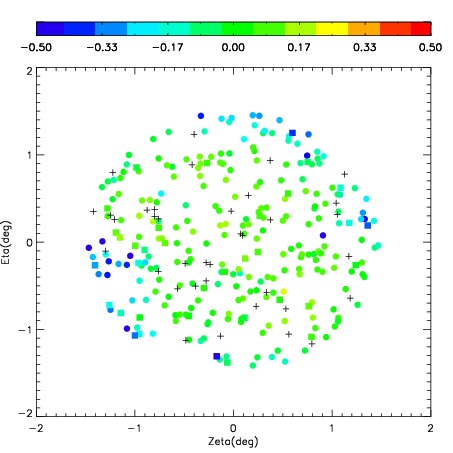
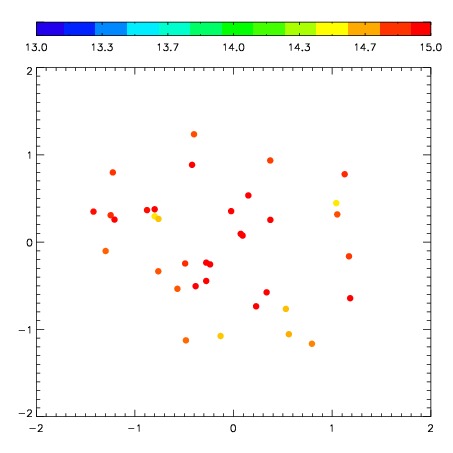
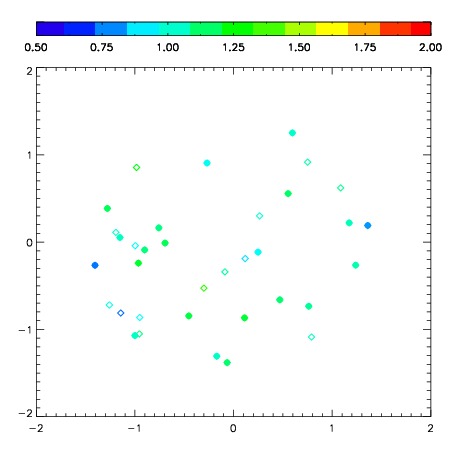
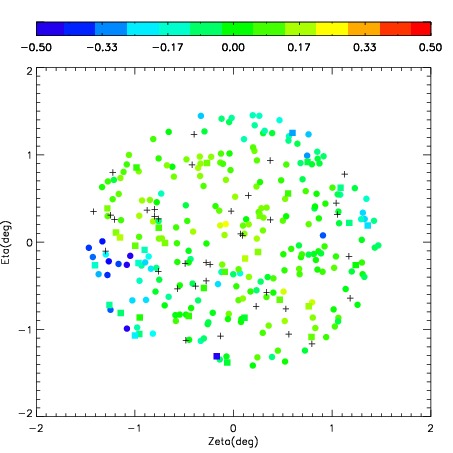
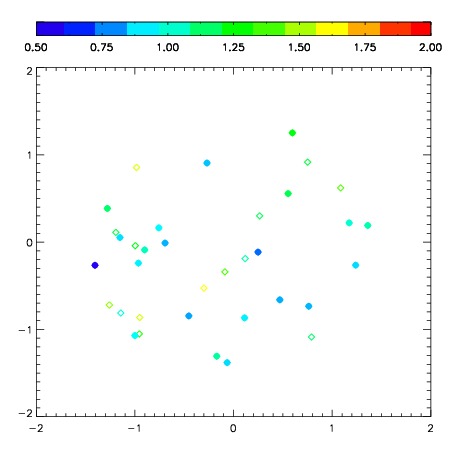
| Spatial sky 16325A emission deviations (filled: sky, open: star)
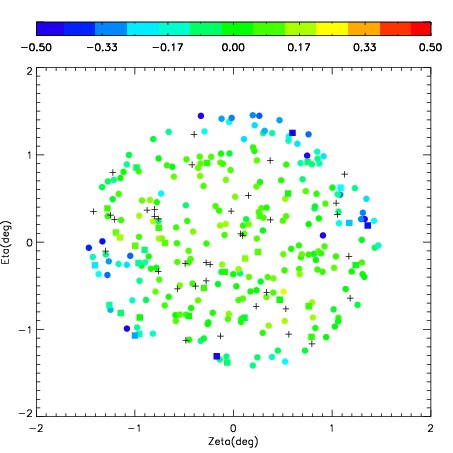
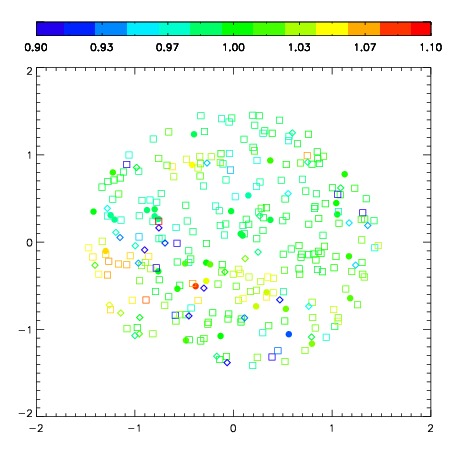
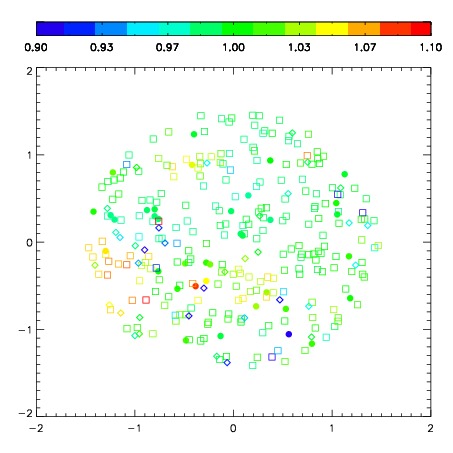
| Spatial sky continuum emission
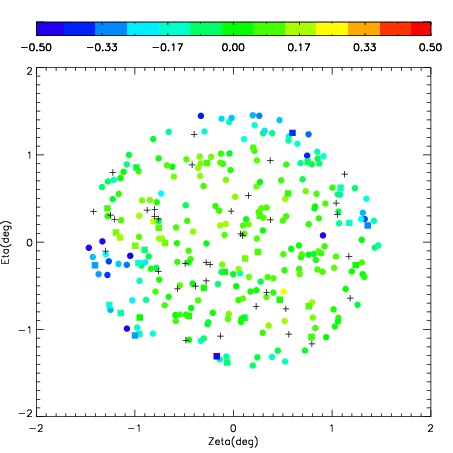
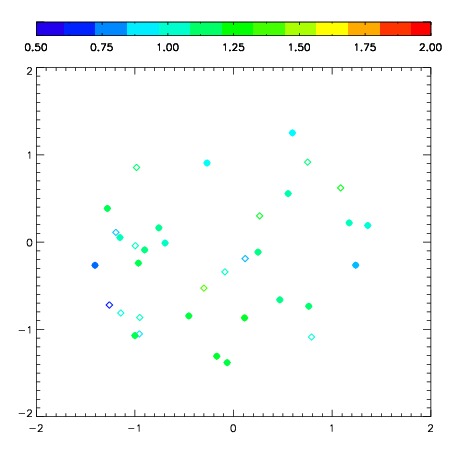
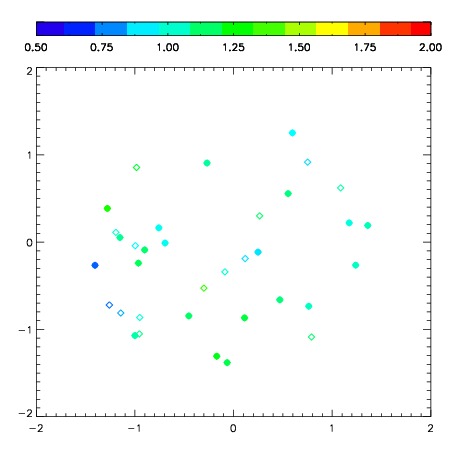
| Spatial sky telluric CO2 absorption deviations (filled: H < 10)
|
| 2860101
| 47
| | Red | Green | Blue
| | z | | 19.06
| | znorm | | 14.88
| | sky | 15.1 | 14.7 | 14.6
| | S/N | 15.2 | 25.3 | 28.1
| | S/N(c) | 13.5 | 23.6 | 26.7
| | SN(E/C) 0.92
|
| 
| 
| 
| 
| 
|
| 2860102
| 47
| | Red | Green | Blue
| | z | | 19.05
| | znorm | | 14.87
| | sky | 14.8 | 14.9 | 15.0
| | S/N | 15.1 | 25.6 | 27.8
| | S/N(c) | 13.3 | 23.8 | 26.6
| | SN(E/C) 0.90
|
| 
| 
| 
| 
| 
|
| 2860103
| 47
| | Red | Green | Blue
| | z | | 19.02
| | znorm | | 14.84
| | sky | 15.0 | 14.9 | 15.0
| | S/N | 14.3 | 24.6 | 26.2
| | S/N(c) | 12.4 | 22.8 | 24.5
| | SN(E/C) 0.96
|
| 
| 
| 
| 
| 
|
| 2860104
| 47
| | Red | Green | Blue
| | z | | 19.05
| | znorm | | 14.87
| | sky | 14.9 | 14.8 | 15.1
| | S/N | 15.0 | 25.5 | 27.4
| | S/N(c) | 13.0 | 23.7 | 25.5
| | SN(E/C) 0.93
|
| 
| 
| 
| 
| 
|
| 2860105
| 47
| | Red | Green | Blue
| | z | | 19.02
| | znorm | | 14.84
| | sky | 15.0 | 14.8 | 15.0
| | S/N | 14.9 | 25.3 | 27.0
| | S/N(c) | 12.9 | 23.4 | 25.3
| | SN(E/C) 0.93
|
| 
| 
| 
| 
| 
|
| 2860106
| 47
| | Red | Green | Blue
| | z | | 18.98
| | znorm | | 14.80
| | sky | 15.0 | 14.8 | 14.8
| | S/N | 14.4 | 24.9 | 26.0
| | S/N(c) | 12.5 | 23.0 | 24.6
| | SN(E/C) 0.98
|
| 
| 
| 
| 
| 
|
| 2860107
| 47
| | Red | Green | Blue
| | z | | 19.01
| | znorm | | 14.83
| | sky | 14.6 | 14.4 | 14.3
| | S/N | 14.6 | 24.6 | 25.3
| | S/N(c) | 12.6 | 22.8 | 24.0
| | SN(E/C) 0.96
|
| 
| 
| 
| 
| 
|
| 2860108
| 47
| | Red | Green | Blue
| | z | | 18.71
| | znorm | | 14.53
| | sky | 12.5 | 12.3 | 12.1
| | S/N | 9.4 | 15.4 | 16.7
| | S/N(c) | 8.6 | 14.6 | 16.0
| | SN(E/C) 0.98
|
| 
| 
| 
| 
| 
|