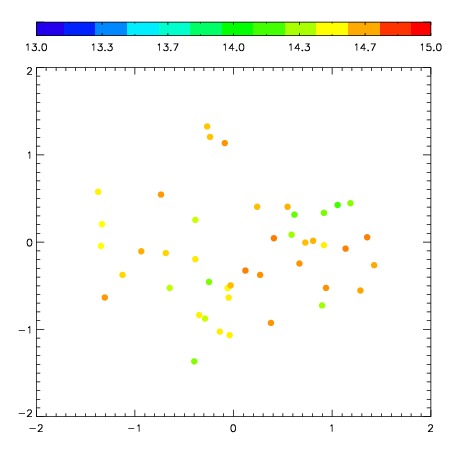
| Frame | Nreads | Zeropoints | Mag plots
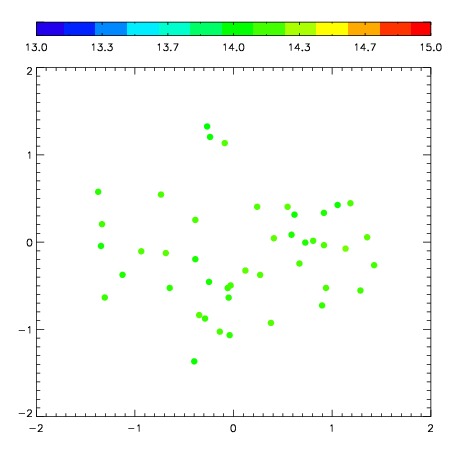
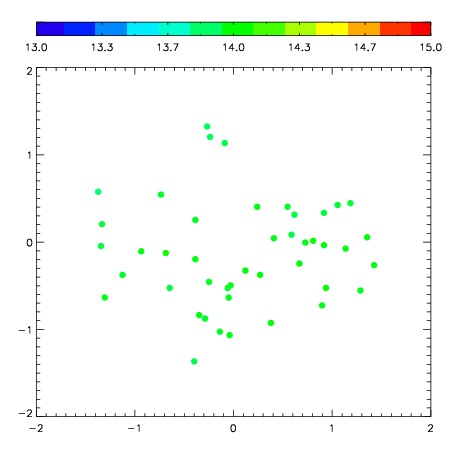
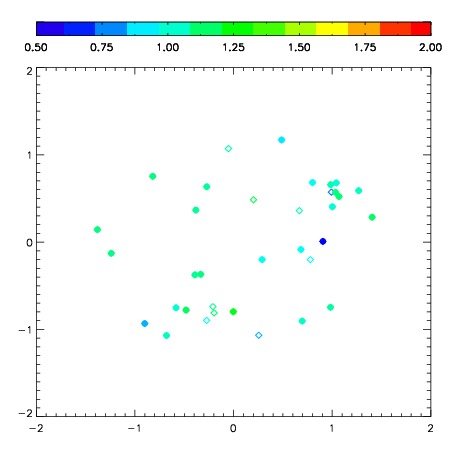
| Spatial mag deviation
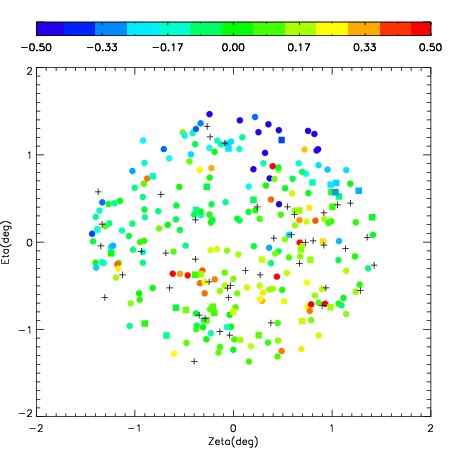
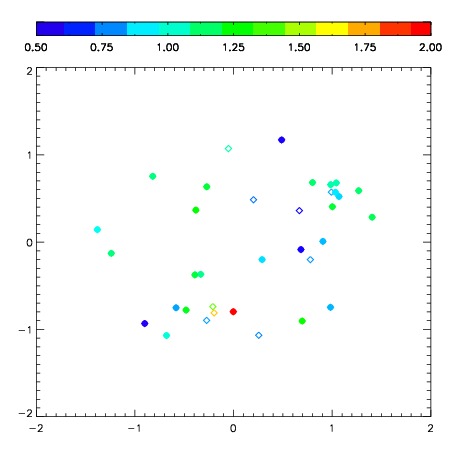
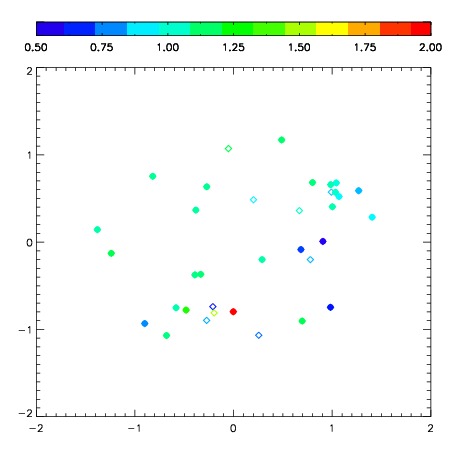
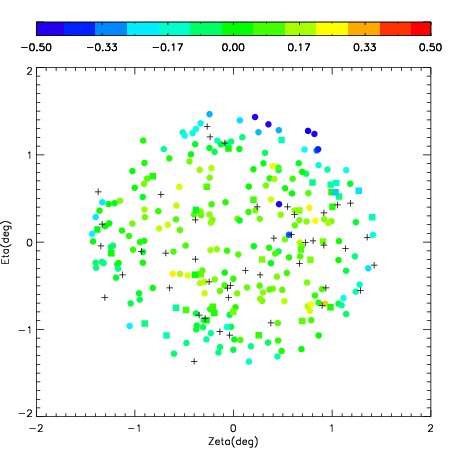
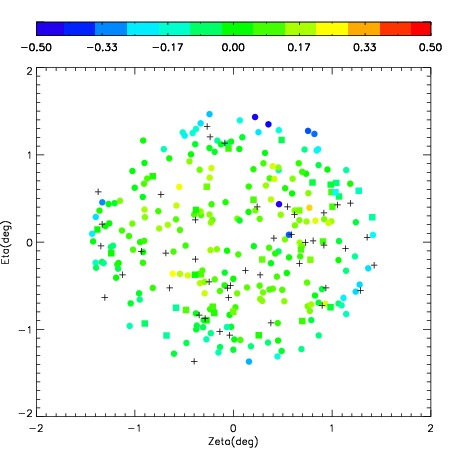
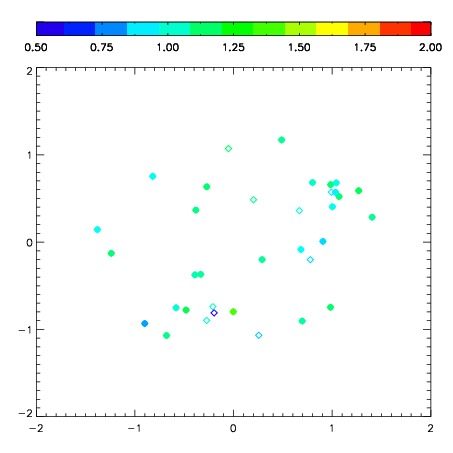
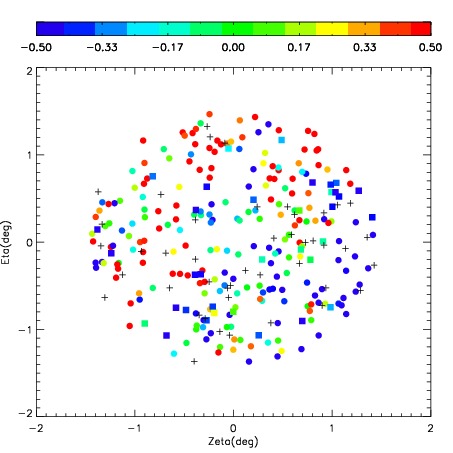
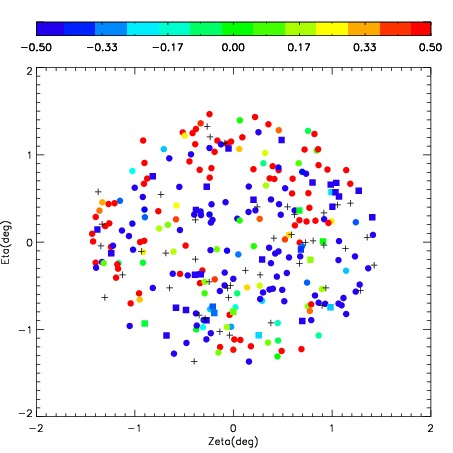
| Spatial sky 16325A emission deviations (filled: sky, open: star)
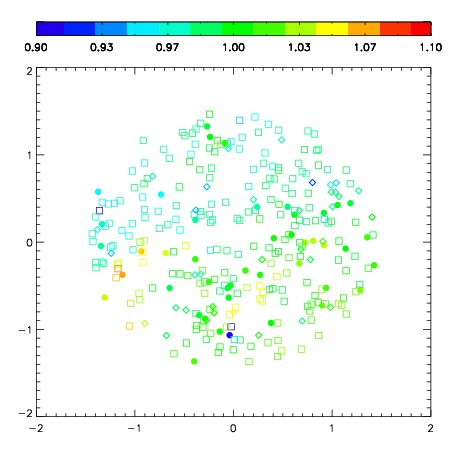
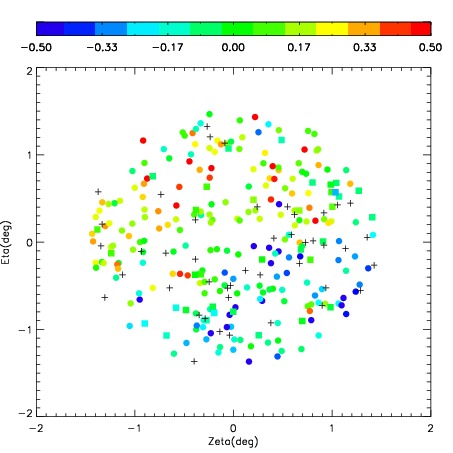
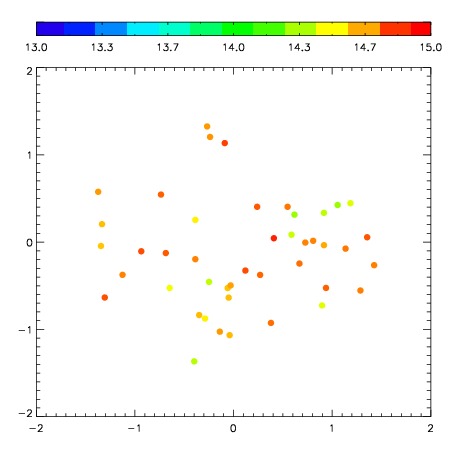
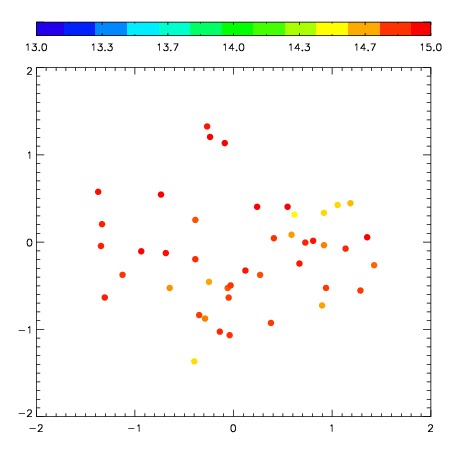
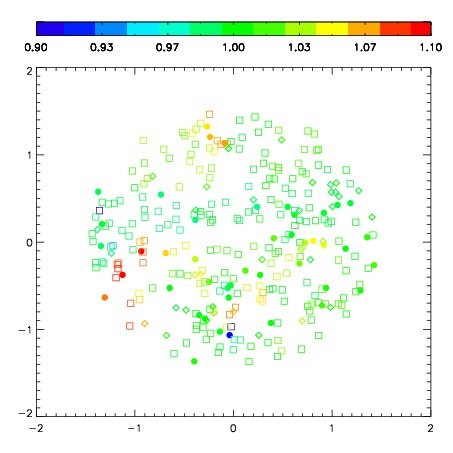
| Spatial sky continuum emission
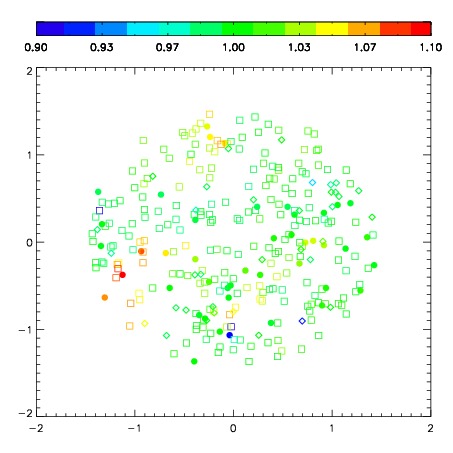
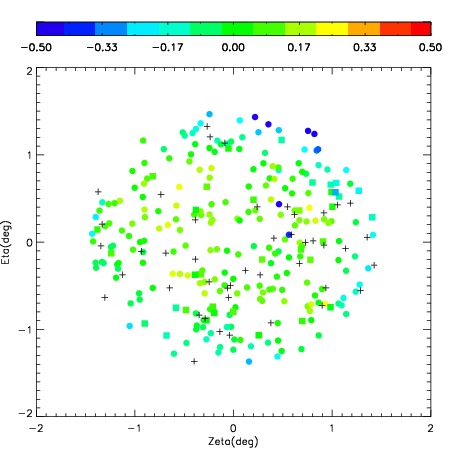
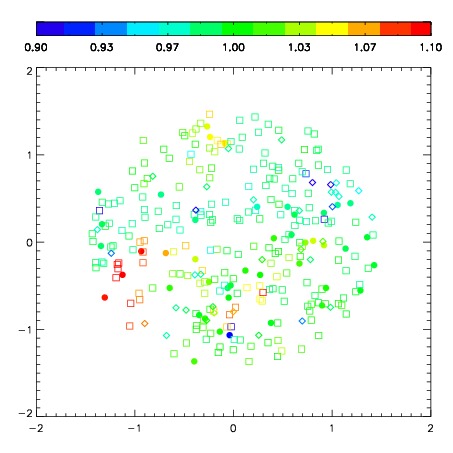
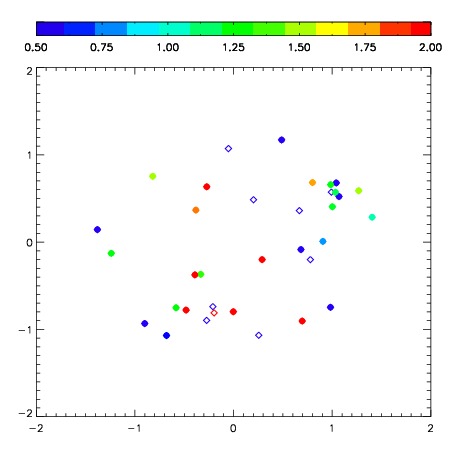
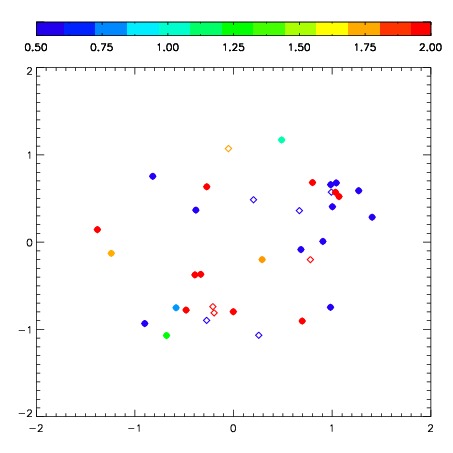
| Spatial sky telluric CO2 absorption deviations (filled: H < 10)
|
| 3120095
| 47
| | Red | Green | Blue
| | z | | 16.26
| | znorm | | 12.08
| | sky | 14.3 | 14.1 | 13.9
| | S/N | 1.8 | 4.0 | 9.1
| | S/N(c) | 1.6 | 3.6 | 8.9
| | SN(E/C) 1.04
|
| 
| 
| 
| 
| 
|
| 3120096
| 47
| | Red | Green | Blue
| | z | | 15.85
| | znorm | | 11.67
| | sky | 13.9 | 13.9 | 14.0
| | S/N | 0.9 | 2.2 | 7.2
| | S/N(c) | 0.8 | 1.8 | 7.1
| | SN(E/C) 1.08
|
| 
| 
| 
| 
| 
|
| 3120097
| 47
| | Red | Green | Blue
| | z | | 18.52
| | znorm | | 14.34
| | sky | 14.4 | 14.5 | 14.2
| | S/N | 11.6 | 18.4 | 20.0
| | S/N(c) | 10.0 | 16.9 | 19.5
| | SN(E/C) 0.91
|
| 
| 
| 
| 
| 
|
| 3120098
| 47
| | Red | Green | Blue
| | z | | 18.35
| | znorm | | 14.17
| | sky | 15.0 | 14.6 | 14.4
| | S/N | 10.3 | 17.3 | 18.5
| | S/N(c) | 8.8 | 15.7 | 17.8
| | SN(E/C) 0.89
|
| 
| 
| 
| 
| 
|
| 3120099
| 47
| | Red | Green | Blue
| | z | | 17.91
| | znorm | | 13.73
| | sky | 14.9 | 14.8 | 14.7
| | S/N | 7.3 | 13.3 | 15.0
| | S/N(c) | 6.3 | 11.7 | 14.2
| | SN(E/C) 0.96
|
| 
| 
| 
| 
| 
|
| 3120100
| 47
| | Red | Green | Blue
| | z | | 17.71
| | znorm | | 13.53
| | sky | 14.8 | 14.8 | 14.7
| | S/N | 6.3 | 11.8 | 14.4
| | S/N(c) | 5.6 | 10.5 | 13.6
| | SN(E/C) 0.95
|
| 
| 
| 
| 
| 
|
| 3120101
| 47
| | Red | Green | Blue
| | z | | 14.13
| | znorm | | 9.95
| | sky | 14.7 | 14.7 | 14.8
| | S/N | 0.1 | 0.8 | 5.8
| | S/N(c) | 0.1 | 0.5 | 5.7
| | SN(E/C) 0.93
|
| 
| 
| 
| 
| 
|
| 3120102
| 47
| | Red | Green | Blue
| | z | | 13.21
| | znorm | | 9.03
| | sky | 15.2 | 15.1 | 15.3
| | S/N | 0.0 | 0.2 | 5.5
| | S/N(c) | 0.0 | 0.0 | 0.0
| | SN(E/C) 1.52
|
| 
| 
| 
| 
| 
|