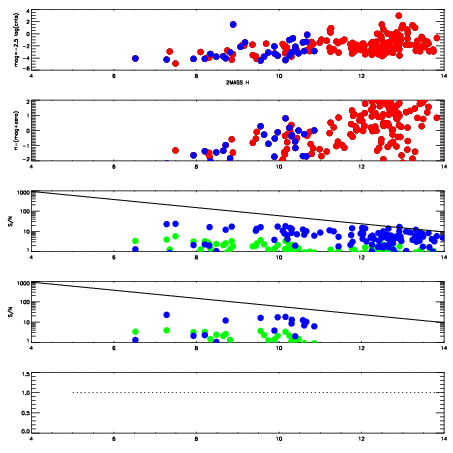
| Red | Green | Blue | |
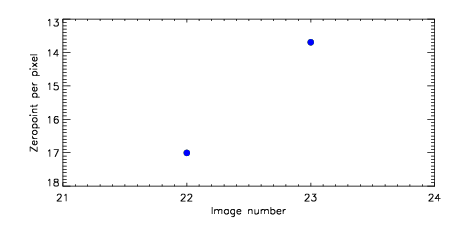
| z | 17.01 | ||
| znorm | 12.83 | ||
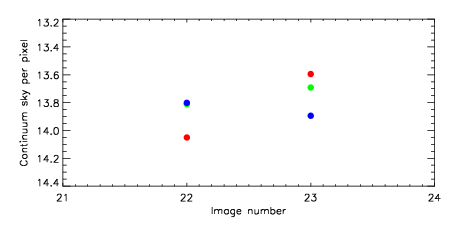
| sky | 14.1 | 13.8 | 13.8 |
| S/N | 3.4 | 6.5 | 8.8 |
| S/N(c) | 3.1 | 6.5 | 8.6 |
| SN(E/C) |

| Red | Green | Blue | |
| z | 13.69 | ||
| znorm | 9.51 | ||
| sky | 13.6 | 13.7 | 13.9 |
| S/N | 0.0 | 0.3 | 4.3 |
| S/N(c) | 0.0 | 0.0 | 0.0 |
| SN(E/C) |
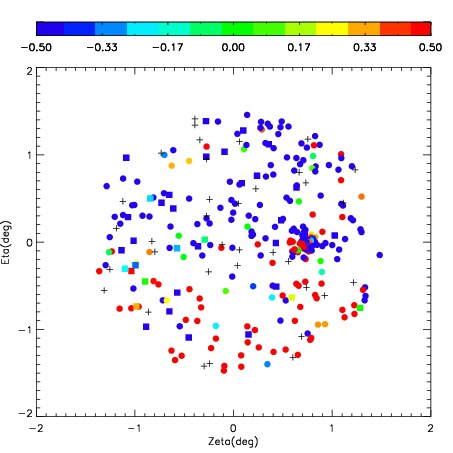
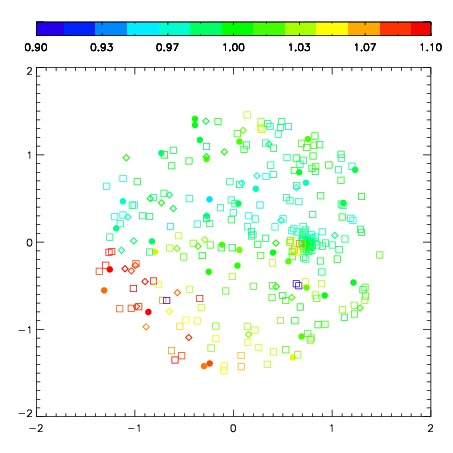
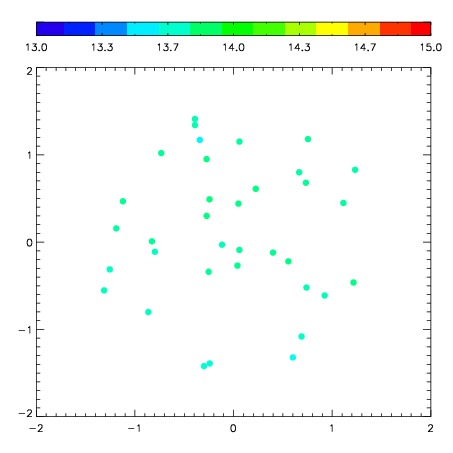
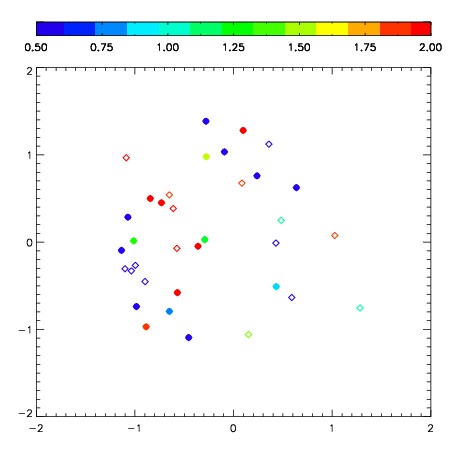
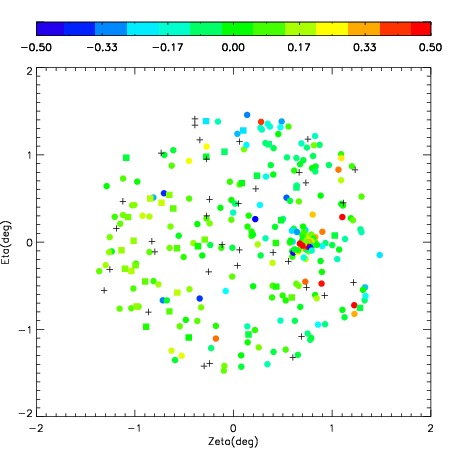
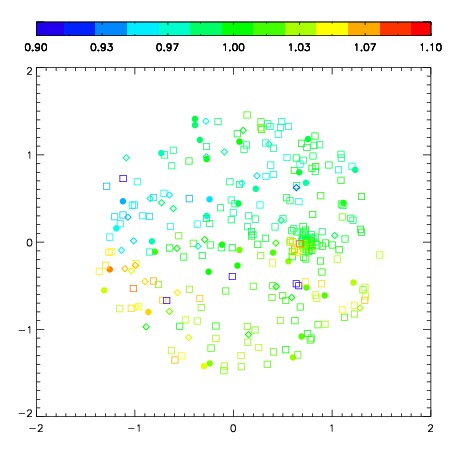
| Frame | Nreads | Zeropoints | Mag plots | Spatial mag deviation | Spatial sky 16325A emission deviations (filled: sky, open: star) | Spatial sky continuum emission | Spatial sky telluric CO2 absorption deviations (filled: H < 10) | |||||||||||||||||||||||
| 8990022 | 47 |
|
|
|
|
|
| |||||||||||||||||||||||
| 8990023 | 47 |
|
|
|
|
|
|
| 
|