| Frame | Nreads | Zeropoints | Mag plots
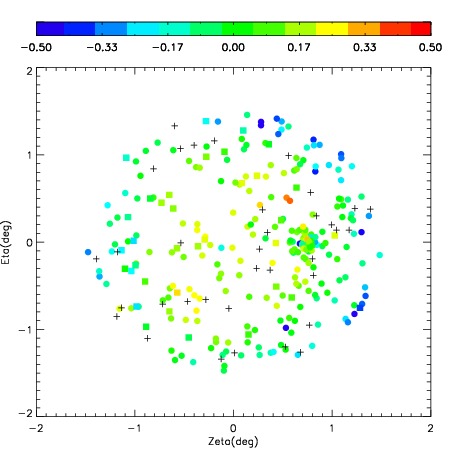
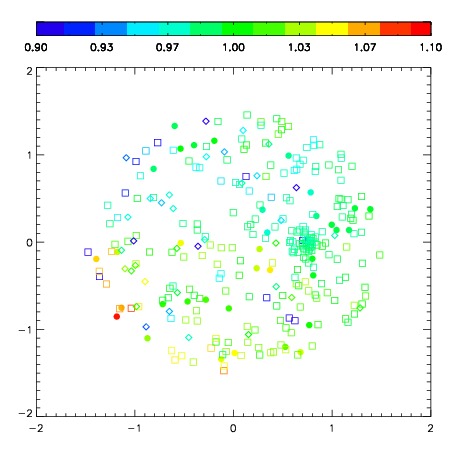
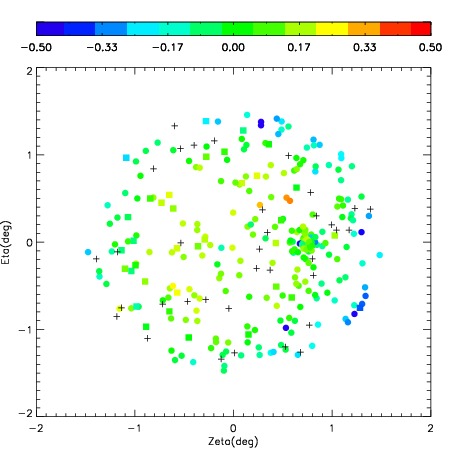
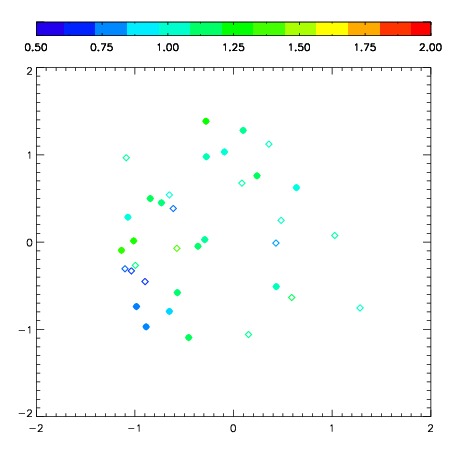
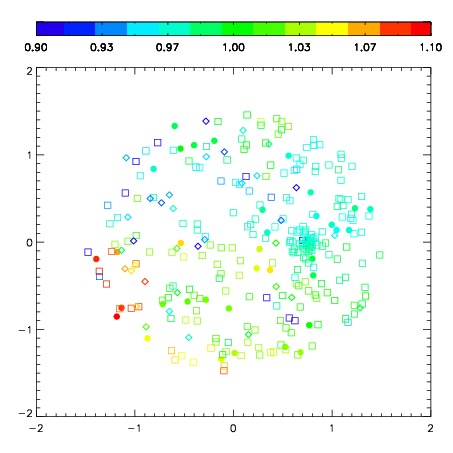
| Spatial mag deviation
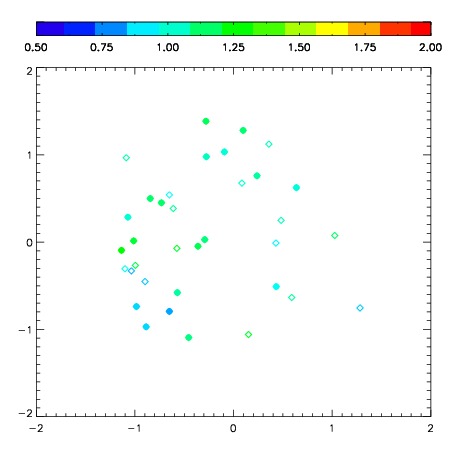
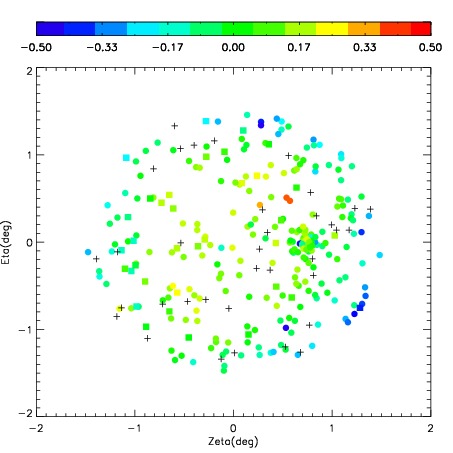
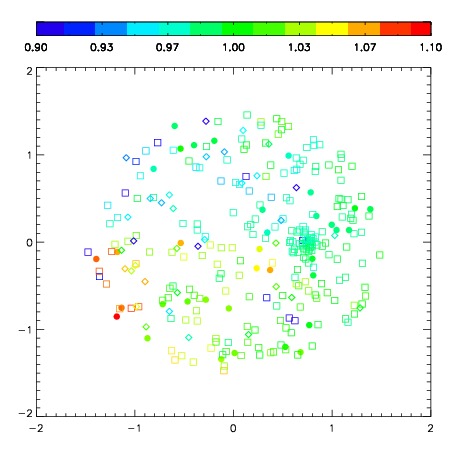
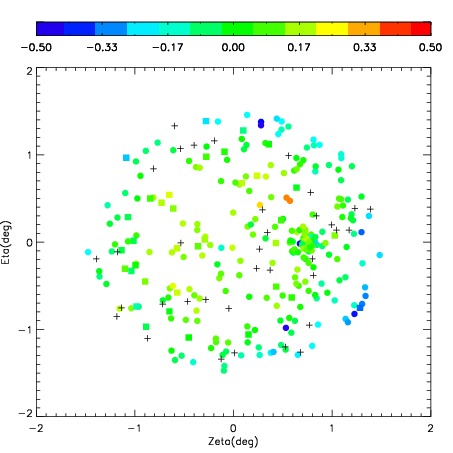
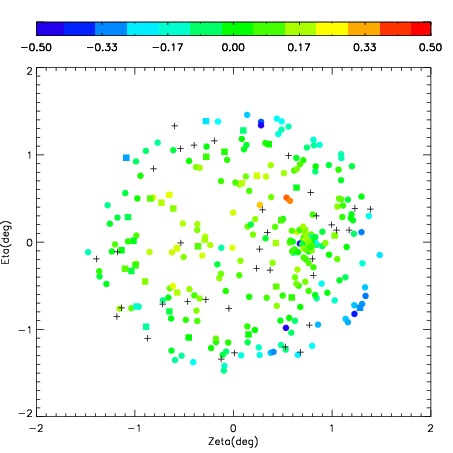
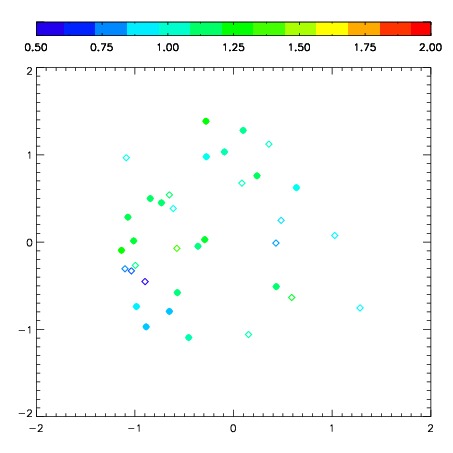
| Spatial sky 16325A emission deviations (filled: sky, open: star)
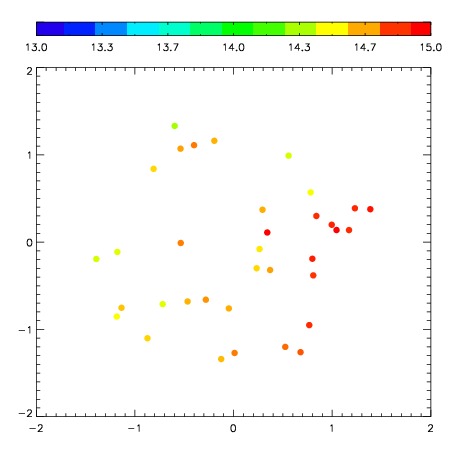
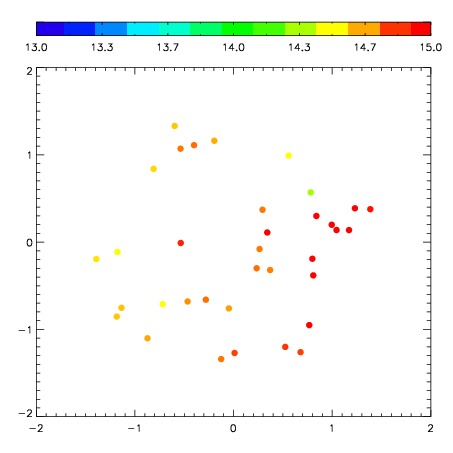
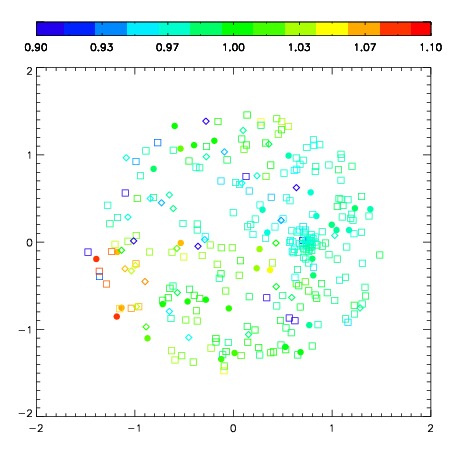
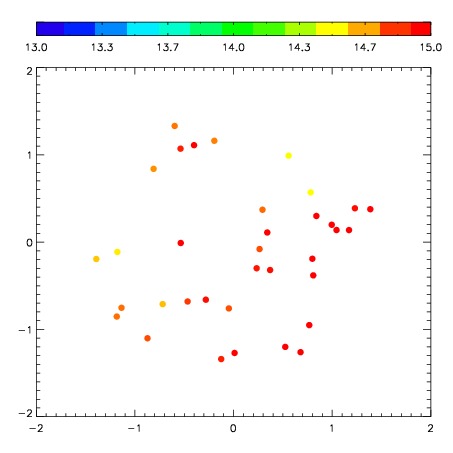
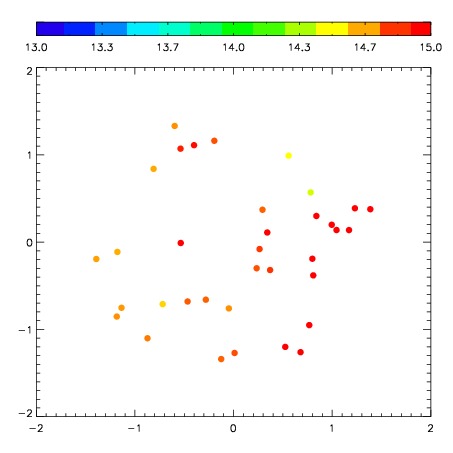
| Spatial sky continuum emission
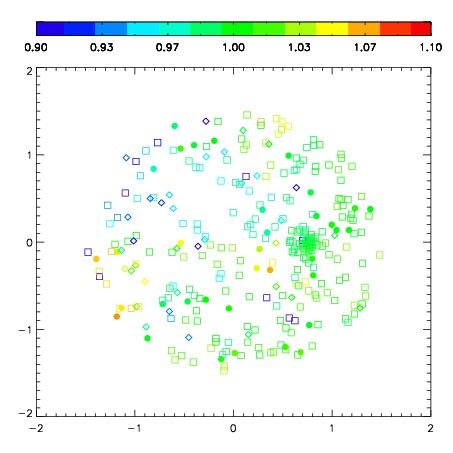
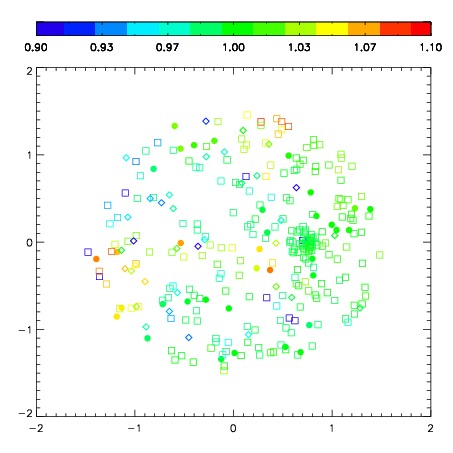
| Spatial sky telluric CO2 absorption deviations (filled: H < 10)
|
| 8400059
| 47
| | Red | Green | Blue
| | z | | 18.69
| | znorm | | 14.51
| | sky | 15.1 | 14.5 | 14.3
| | S/N | 13.4 | 22.0 | 23.0
| | S/N(c) | 11.4 | 20.7 | 22.1
| | SN(E/C) 0.72
|
| 
| 
| 
| 
| 
|
| 8400060
| 47
| | Red | Green | Blue
| | z | | 18.76
| | znorm | | 14.58
| | sky | 15.2 | 14.6 | 14.7
| | S/N | 13.9 | 22.6 | 24.8
| | S/N(c) | 12.1 | 21.3 | 23.7
| | SN(E/C) 0.70
|
| 
| 
| 
| 
| 
|
| 8400061
| 47
| | Red | Green | Blue
| | z | | 18.85
| | znorm | | 14.67
| | sky | 15.0 | 14.7 | 14.7
| | S/N | 14.8 | 23.8 | 26.2
| | S/N(c) | 12.8 | 22.4 | 25.0
| | SN(E/C) 0.67
|
| 
| 
| 
| 
| 
|
| 8400062
| 47
| | Red | Green | Blue
| | z | | 18.94
| | znorm | | 14.76
| | sky | 14.7 | 14.7 | 14.7
| | S/N | 15.4 | 25.0 | 27.1
| | S/N(c) | 13.5 | 23.5 | 26.0
| | SN(E/C) 0.62
|
| 
| 
| 
| 
| 
|
| 8400063
| 47
| | Red | Green | Blue
| | z | | 18.90
| | znorm | | 14.72
| | sky | 15.3 | 14.8 | 14.7
| | S/N | 14.6 | 24.4 | 26.8
| | S/N(c) | 12.9 | 23.0 | 25.6
| | SN(E/C) 0.68
|
| 
| 
| 
| 
| 
|
| 8400064
| 47
| | Red | Green | Blue
| | z | | 18.94
| | znorm | | 14.76
| | sky | 14.9 | 14.8 | 14.8
| | S/N | 15.1 | 24.9 | 27.5
| | S/N(c) | 13.0 | 23.4 | 26.0
| | SN(E/C) 0.60
|
| 
| 
| 
| 
| 
|
| 8400065
| 47
| | Red | Green | Blue
| | z | | 18.95
| | znorm | | 14.77
| | sky | 14.9 | 14.8 | 14.8
| | S/N | 15.2 | 25.2 | 27.4
| | S/N(c) | 13.3 | 23.3 | 26.0
| | SN(E/C) 0.63
|
| 
| 
| 
| 
| 
|
| 8400066
| 47
| | Red | Green | Blue
| | z | | 18.99
| | znorm | | 14.81
| | sky | 15.0 | 14.7 | 14.7
| | S/N | 15.5 | 25.5 | 27.8
| | S/N(c) | 13.6 | 24.1 | 26.3
| | SN(E/C) 0.62
|
| 
| 
| 
| 
| 
|