| Frame | Nreads | Zeropoints | Mag plots
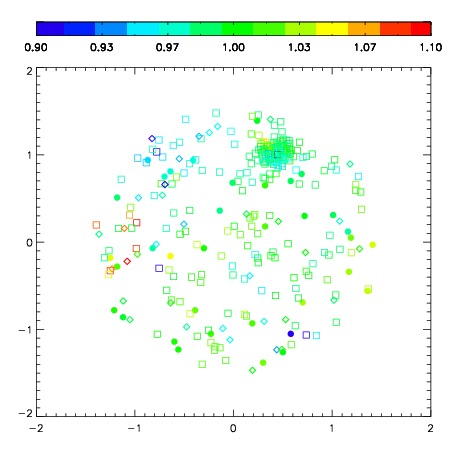
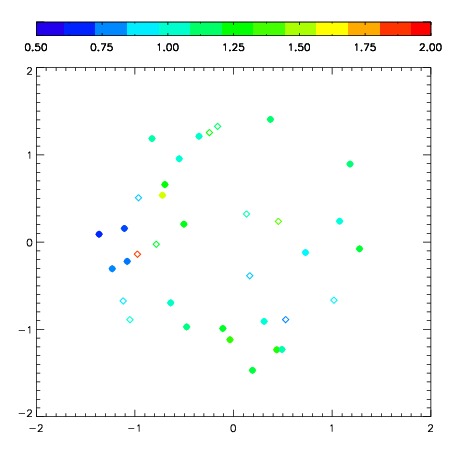
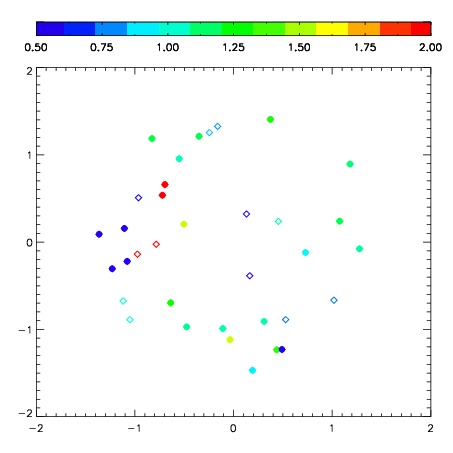
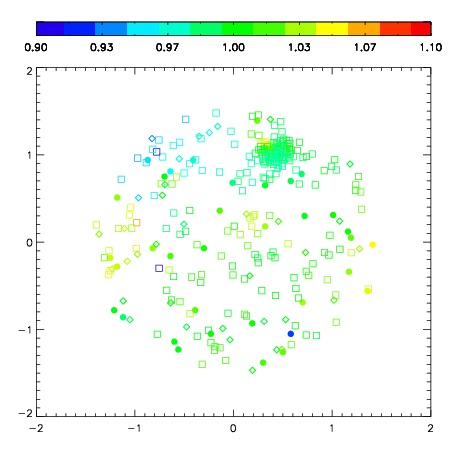
| Spatial mag deviation
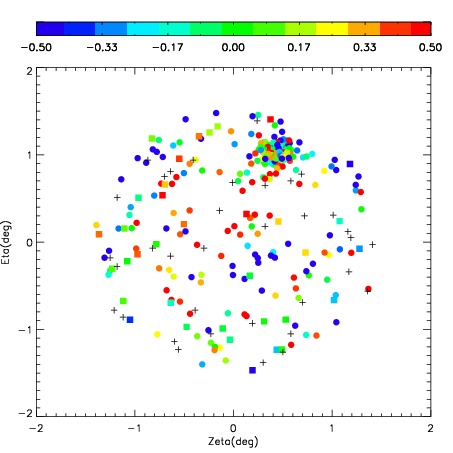
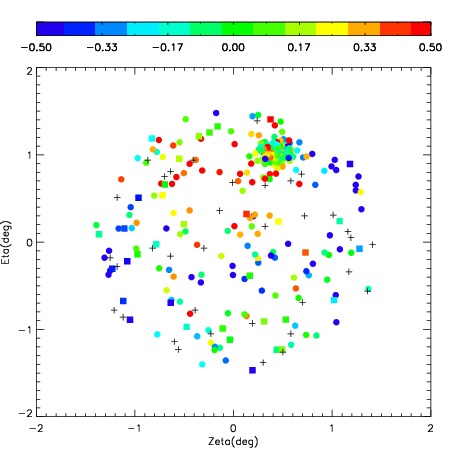
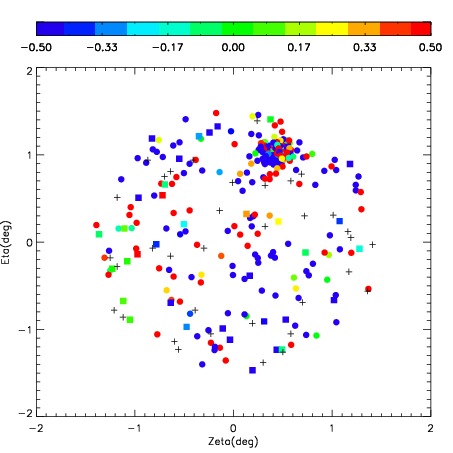
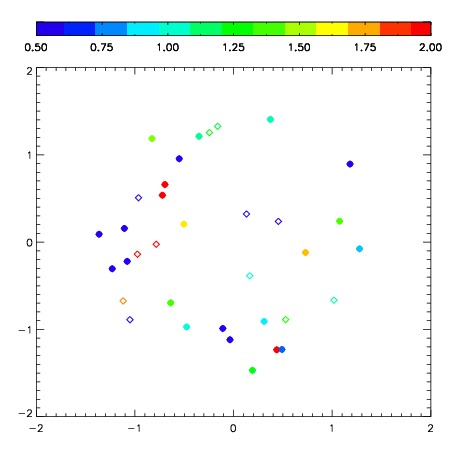
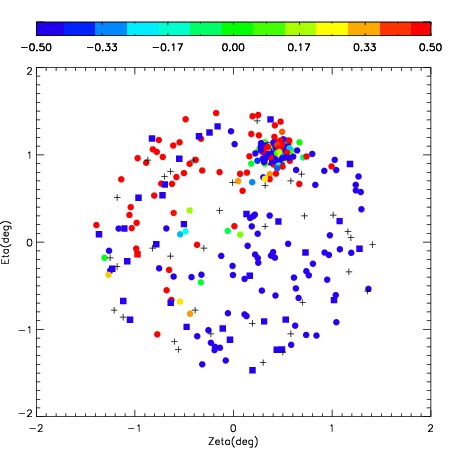
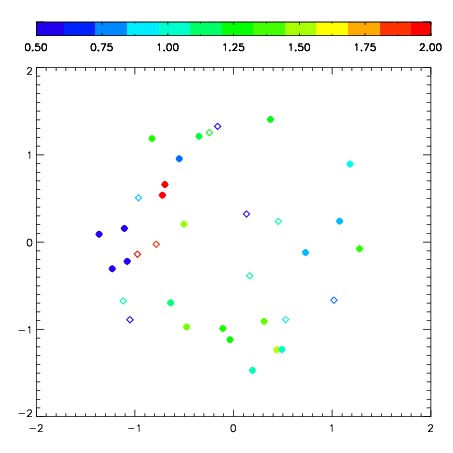
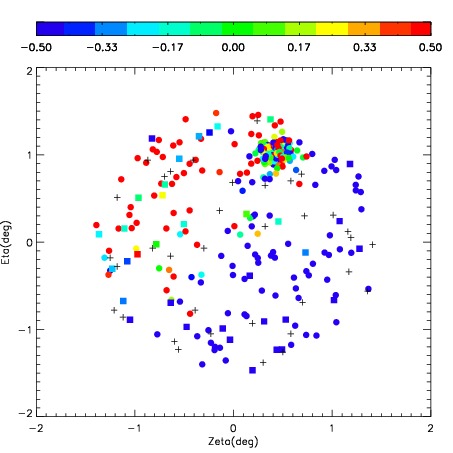
| Spatial sky 16325A emission deviations (filled: sky, open: star)
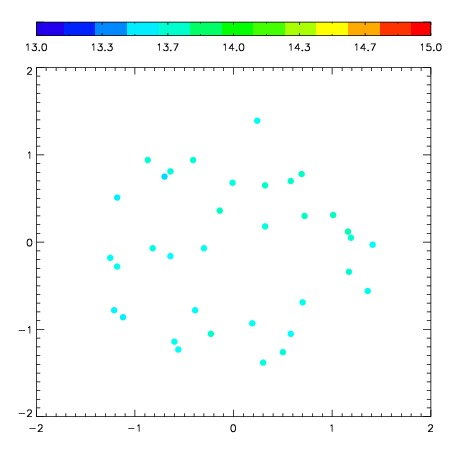
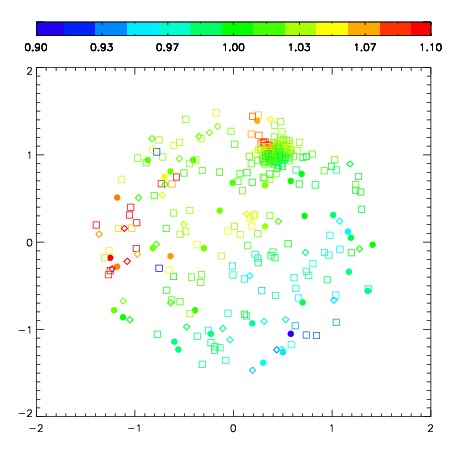
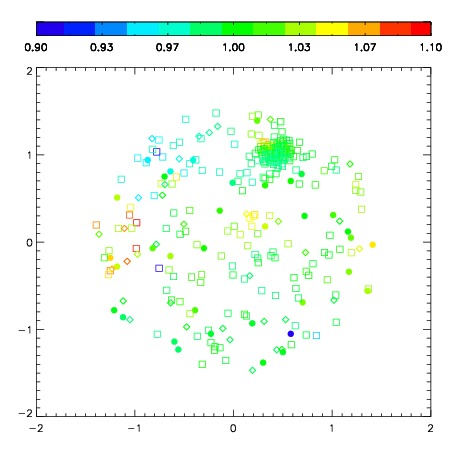
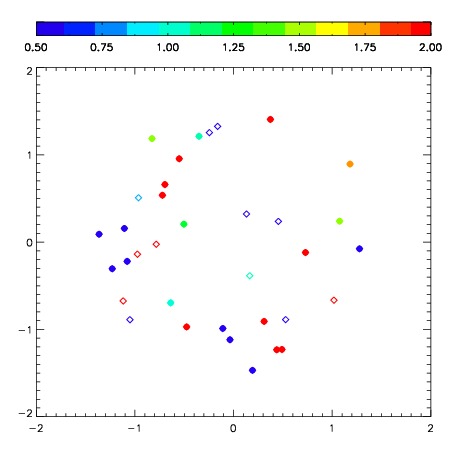
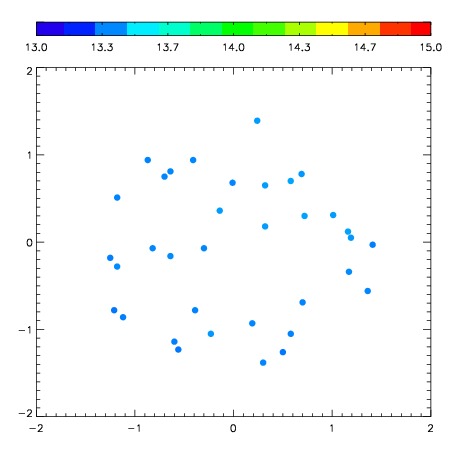
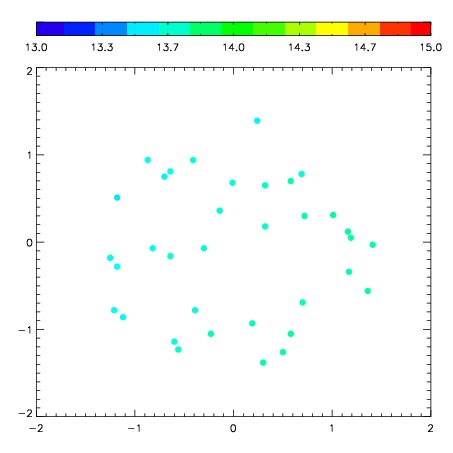
| Spatial sky continuum emission
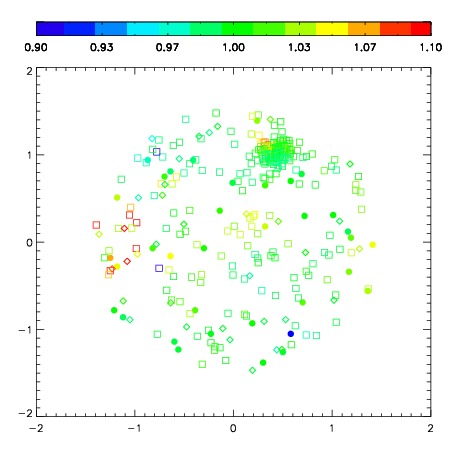
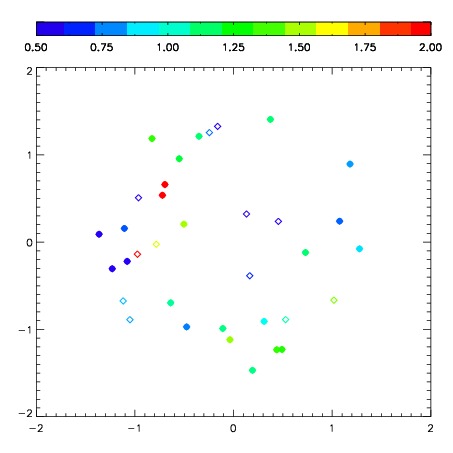
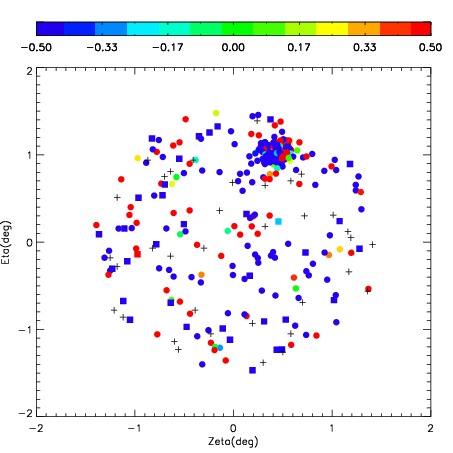
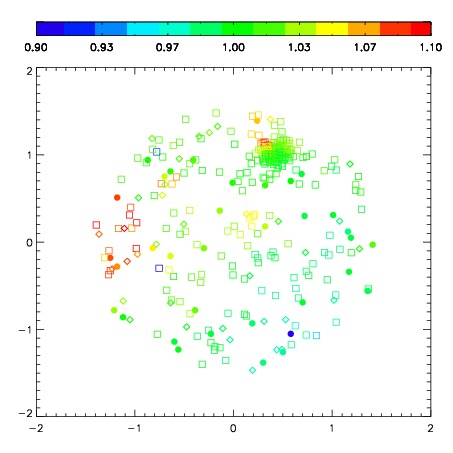
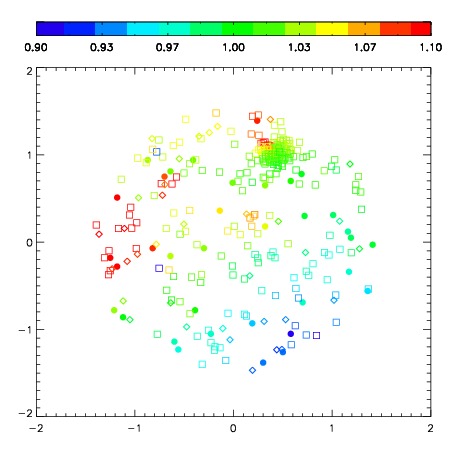
| Spatial sky telluric CO2 absorption deviations (filled: H < 10)
|
| 4880037
| 47
| | Red | Green | Blue
| | z | | 17.92
| | znorm | | 13.74
| | sky | 13.7 | 13.6 | 13.5
| | S/N | 6.3 | 12.2 | 12.5
| | S/N(c) | 5.4 | 11.4 | 12.7
| | SN(E/C) 0.60
|
| 
| 
| 
| 
| 
|
| 4880038
| 47
| | Red | Green | Blue
| | z | | 15.55
| | znorm | | 11.37
| | sky | 13.0 | 13.1 | 13.3
| | S/N | 0.4 | 1.6 | 0.9
| | S/N(c) | 0.5 | 1.8 | 1.9
| | SN(E/C) 1.02
|
| 
| 
| 
| 
| 
|
| 4880039
| 47
| | Red | Green | Blue
| | z | | 16.05
| | znorm | | 11.87
| | sky | 13.2 | 13.2 | 13.4
| | S/N | 1.2 | 2.6 | 1.6
| | S/N(c) | 1.1 | 2.5 | 2.5
| | SN(E/C) 0.92
|
| 
| 
| 
| 
| 
|
| 4880040
| 47
| | Red | Green | Blue
| | z | | 13.58
| | znorm | | 9.40
| | sky | 13.3 | 13.3 | 13.7
| | S/N | 0.1 | 0.3 | -0.7
| | S/N(c) | 0.0 | 0.0 | 0.0
| | SN(E/C) 3.99
|
| 
| 
| 
| 
| 
|
| 4880041
| 47
| | Red | Green | Blue
| | z | | 13.14
| | znorm | | 8.96
| | sky | 13.4 | 13.4 | 13.8
| | S/N | -0.1 | -0.0 | -0.8
| | S/N(c) | 0.0 | 0.0 | 0.0
| | SN(E/C)10.46
|
| 
| 
| 
| 
| 
|
| 4880042
| 47
| | Red | Green | Blue
| | z | | 13.83
| | znorm | | 9.65
| | sky | 13.3 | 13.3 | 13.6
| | S/N | 0.0 | 0.4 | -0.8
| | S/N(c) | 0.0 | 0.0 | 0.0
| | SN(E/C)10.88
|
| 
| 
| 
| 
| 
|
| 4880043
| 47
| | Red | Green | Blue
| | z | | 15.36
| | znorm | | 11.18
| | sky | 13.2 | 13.3 | 13.5
| | S/N | 0.7 | 1.4 | 0.8
| | S/N(c) | 0.6 | 1.6 | 1.5
| | SN(E/C) 1.02
|
| 
| 
| 
| 
| 
|
| 4880044
| 47
| | Red | Green | Blue
| | z | | 14.42
| | znorm | | 10.24
| | sky | 13.6 | 13.6 | 14.0
| | S/N | 0.3 | 0.7 | -0.0
| | S/N(c) | 0.0 | 0.0 | 0.0
| | SN(E/C) 2.19
|
| 
| 
| 
| 
| 
|