| Frame | Nreads | Zeropoints | Mag plots
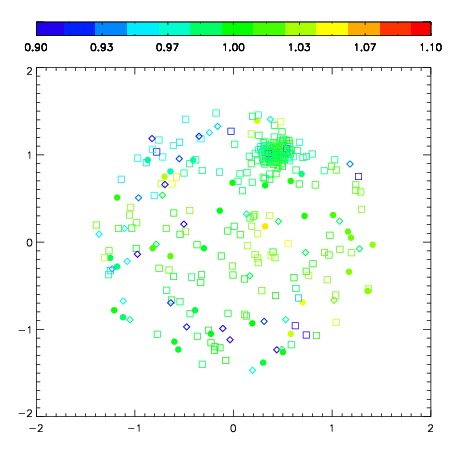
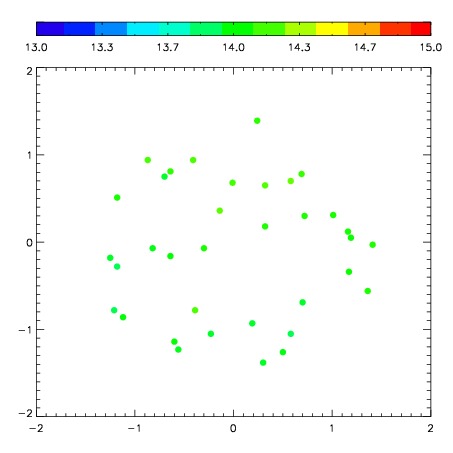
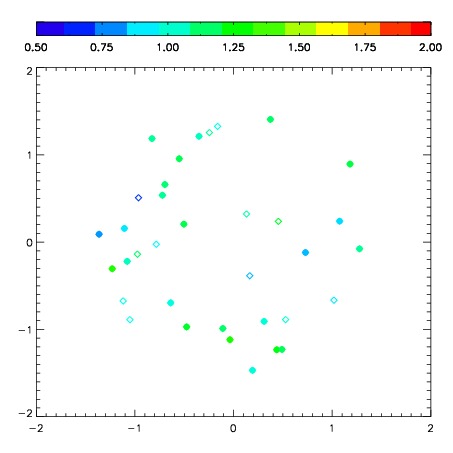
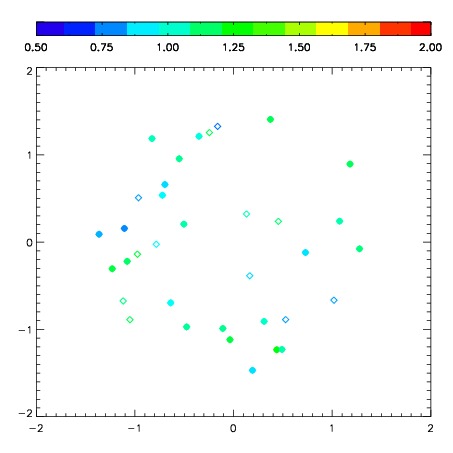
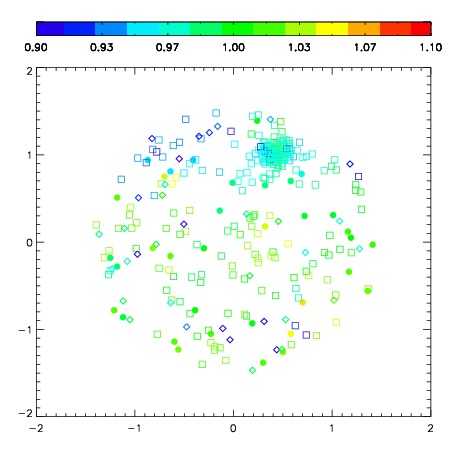
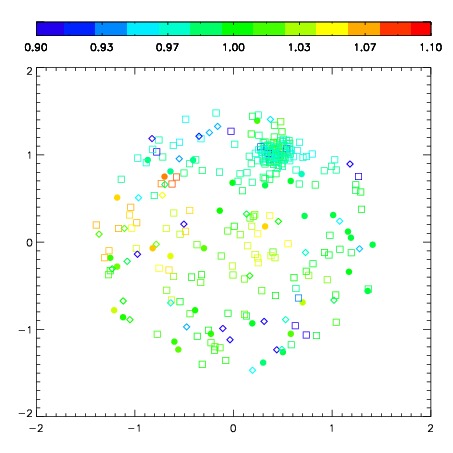
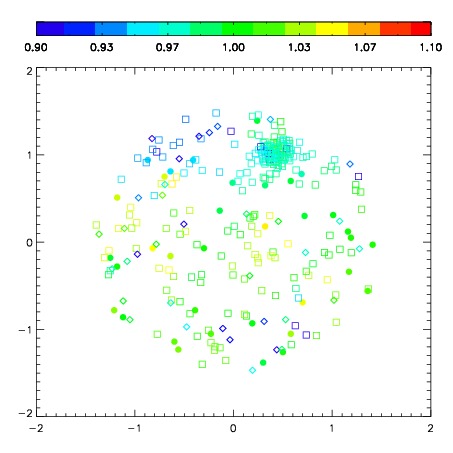
| Spatial mag deviation
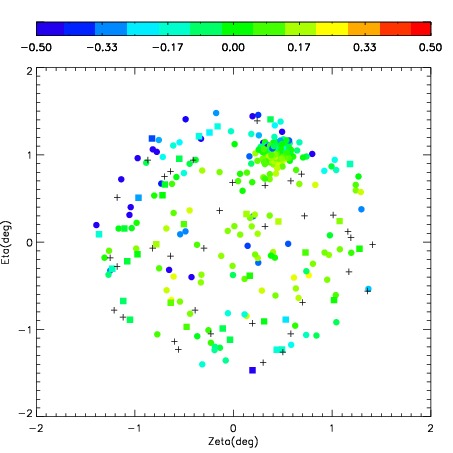
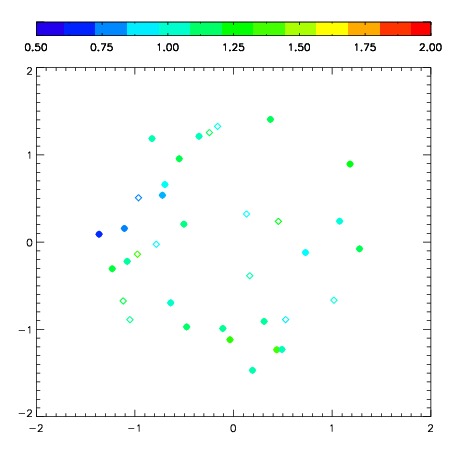
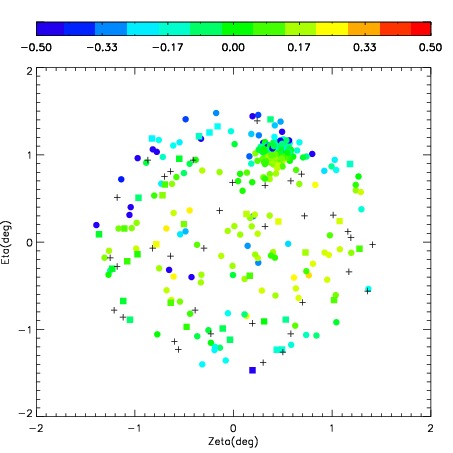
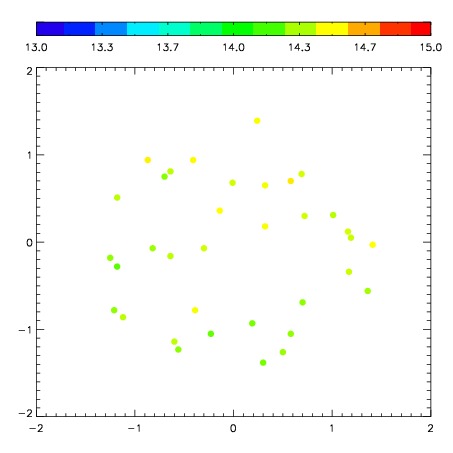
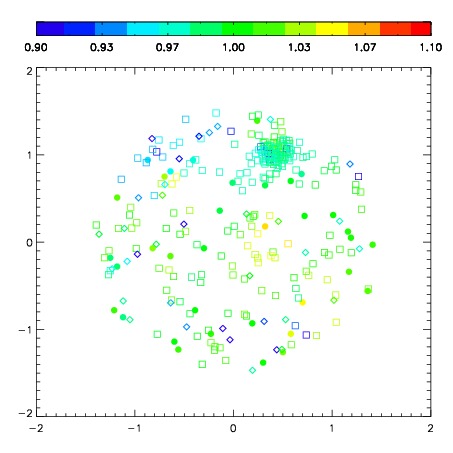
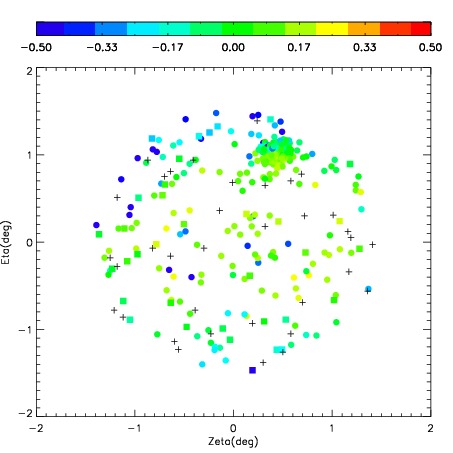
| Spatial sky 16325A emission deviations (filled: sky, open: star)
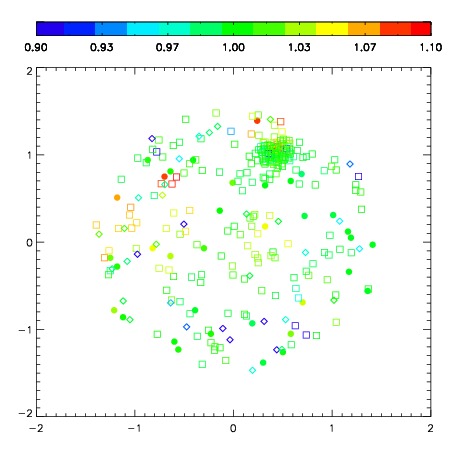
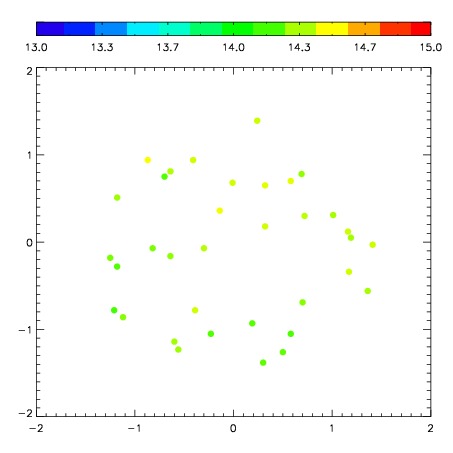
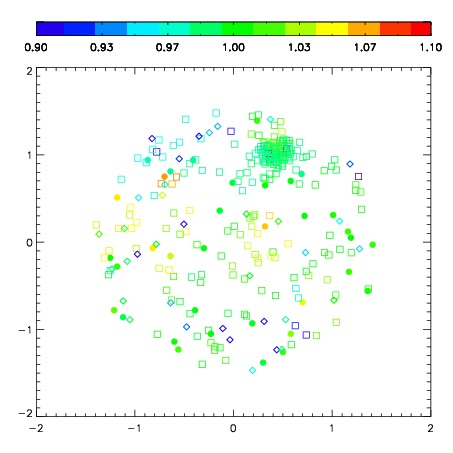
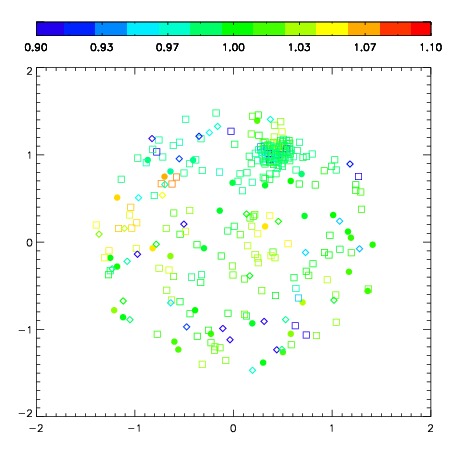
| Spatial sky continuum emission
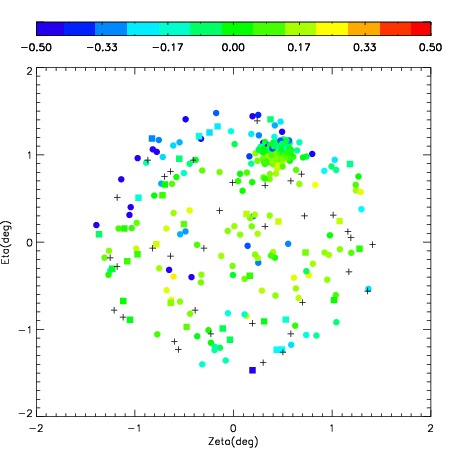
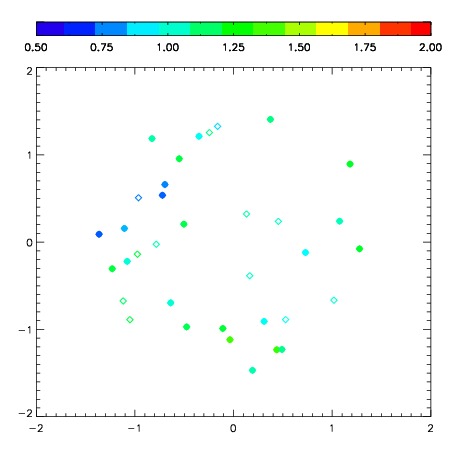
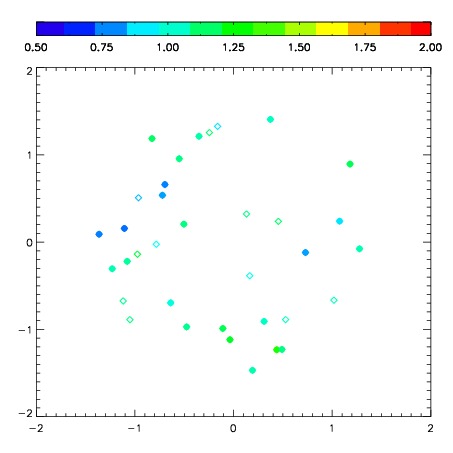
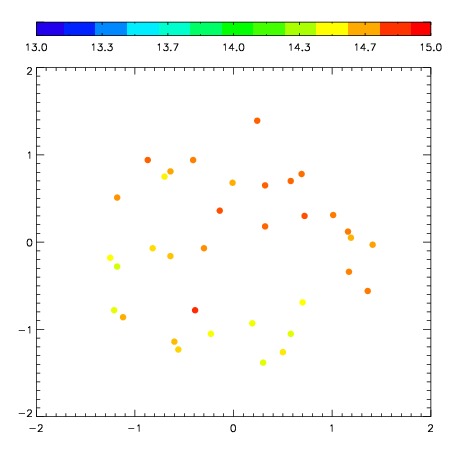
| Spatial sky telluric CO2 absorption deviations (filled: H < 10)
|
| 5160025
| 47
| | Red | Green | Blue
| | z | | 18.87
| | znorm | | 14.69
| | sky | 14.3 | 14.0 | 13.9
| | S/N | 15.5 | 25.6 | 26.3
| | S/N(c) | 13.9 | 24.4 | 25.8
| | SN(E/C) 0.42
|
| 
| 
| 
| 
| 
|
| 5160026
| 47
| | Red | Green | Blue
| | z | | 18.93
| | znorm | | 14.75
| | sky | 14.3 | 14.2 | 14.1
| | S/N | 15.9 | 26.6 | 27.5
| | S/N(c) | 14.2 | 25.1 | 26.6
| | SN(E/C) 0.42
|
| 
| 
| 
| 
| 
|
| 5160027
| 47
| | Red | Green | Blue
| | z | | 18.90
| | znorm | | 14.72
| | sky | 14.3 | 14.2 | 14.1
| | S/N | 15.6 | 26.0 | 27.1
| | S/N(c) | 13.7 | 24.5 | 26.3
| | SN(E/C) 0.44
|
| 
| 
| 
| 
| 
|
| 5160028
| 47
| | Red | Green | Blue
| | z | | 18.83
| | znorm | | 14.65
| | sky | 14.4 | 14.3 | 14.2
| | S/N | 14.8 | 24.8 | 25.8
| | S/N(c) | 13.1 | 23.4 | 25.1
| | SN(E/C) 0.45
|
| 
| 
| 
| 
| 
|
| 5160029
| 47
| | Red | Green | Blue
| | z | | 18.79
| | znorm | | 14.61
| | sky | 14.5 | 14.3 | 14.3
| | S/N | 14.2 | 24.2 | 25.0
| | S/N(c) | 12.6 | 22.8 | 24.2
| | SN(E/C) 0.47
|
| 
| 
| 
| 
| 
|
| 5160030
| 47
| | Red | Green | Blue
| | z | | 18.86
| | znorm | | 14.68
| | sky | 14.4 | 14.3 | 14.2
| | S/N | 15.1 | 25.5 | 26.6
| | S/N(c) | 13.3 | 24.1 | 25.7
| | SN(E/C) 0.45
|
| 
| 
| 
| 
| 
|
| 5160031
| 47
| | Red | Green | Blue
| | z | | 18.90
| | znorm | | 14.72
| | sky | 14.3 | 14.4 | 14.3
| | S/N | 15.6 | 26.3 | 27.5
| | S/N(c) | 13.9 | 24.8 | 26.5
| | SN(E/C) 0.44
|
| 
| 
| 
| 
| 
|
| 5160032
| 47
| | Red | Green | Blue
| | z | | 18.88
| | znorm | | 14.70
| | sky | 14.5 | 14.6 | 14.6
| | S/N | 15.4 | 26.4 | 27.5
| | S/N(c) | 13.8 | 24.9 | 26.6
| | SN(E/C) 0.44
|
| 
| 
| 
| 
| 
|