| Red | Green | Blue | |
| z | 17.64 | ||
| znorm | Inf | ||
| sky | -Inf | -NaN | -Inf |
| S/N | 26.1 | 38.1 | 41.6 |
| S/N(c) | 0.0 | 0.0 | 0.0 |
| SN(E/C) |
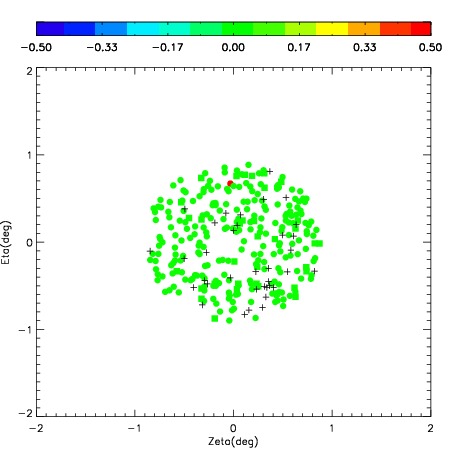
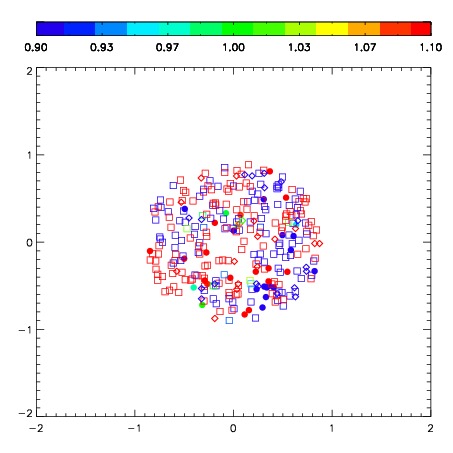

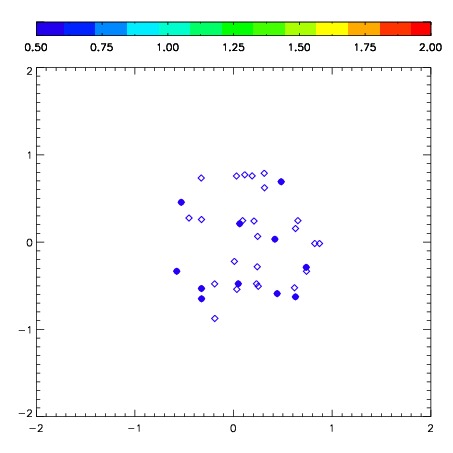
| Frame | Nreads | Zeropoints | Mag plots | Spatial mag deviation | Spatial sky 16325A emission deviations (filled: sky, open: star) | Spatial sky continuum emission | Spatial sky telluric CO2 absorption deviations (filled: H < 10) | |||||||||||||||||||||||
| 0 | 0 |
|
|
|
|
|
|
| IPAIR | NAME | SHIFT | NEWSHIFT | S/N | NAME | SHIFT | NEWSHIFT | S/N |
| 0 | 08530064 | 0.701146 | 0.00000 | 232.034 | 08530063 | 0.00000 | 0.701146 | 213.633 |
| 1 | 08530065 | 0.672266 | 0.0288800 | 252.862 | 08530067 | 0.211132 | 0.490014 | 253.092 |
| 2 | 08530069 | 0.691135 | 0.0100110 | 235.079 | 08530066 | 0.207180 | 0.493966 | 252.754 |
| 3 | 08530068 | 0.688519 | 0.0126270 | 233.823 | 08530070 | 0.207650 | 0.493496 | 244.376 |