| Frame | Nreads | Zeropoints | Mag plots
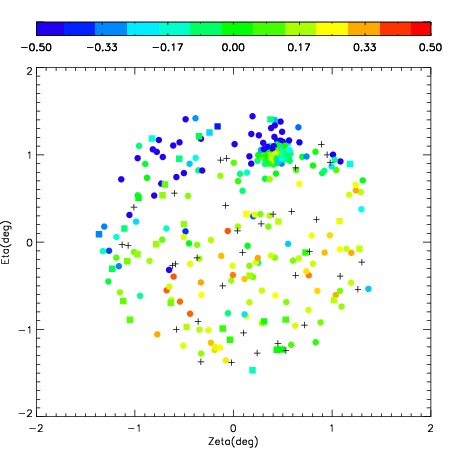
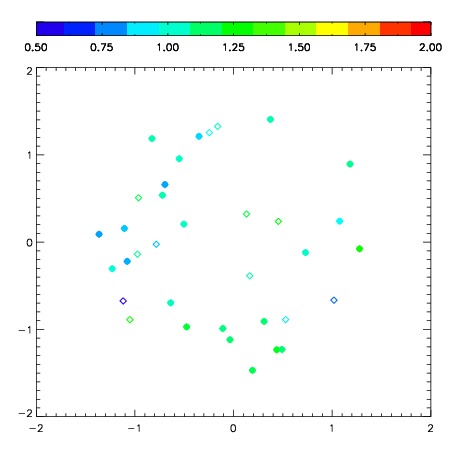
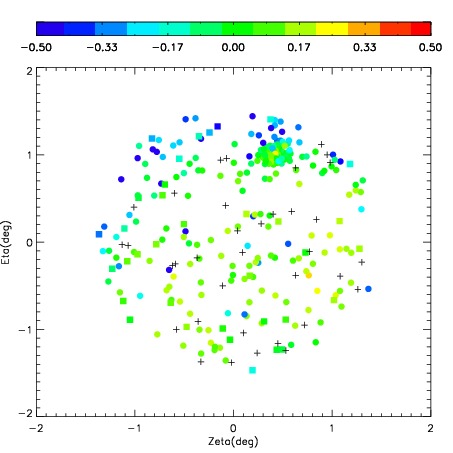
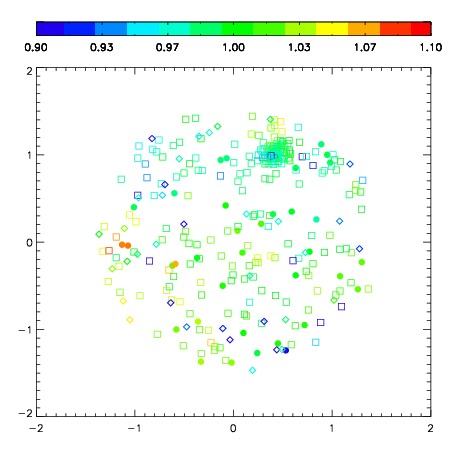
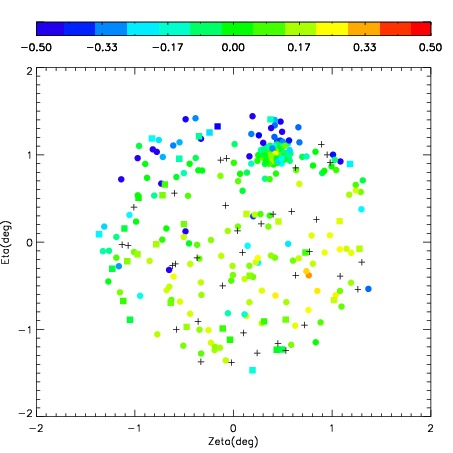
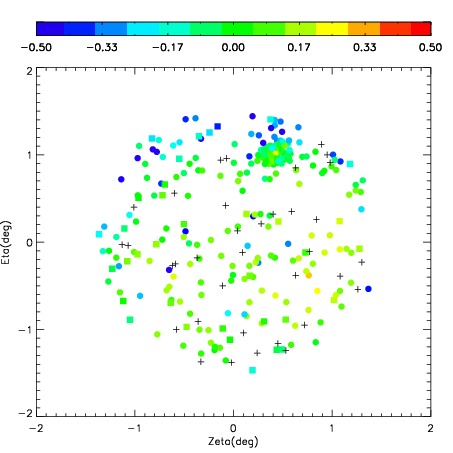
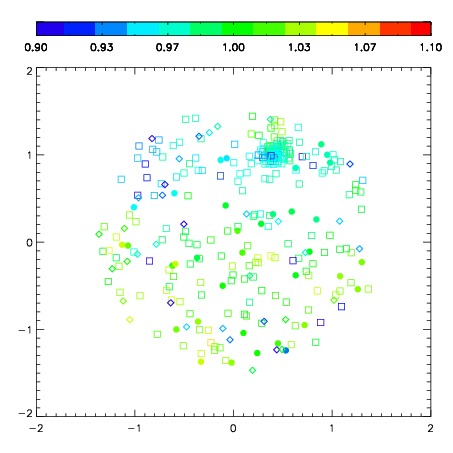
| Spatial mag deviation
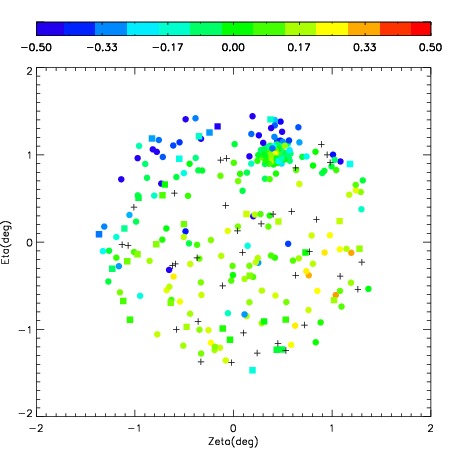
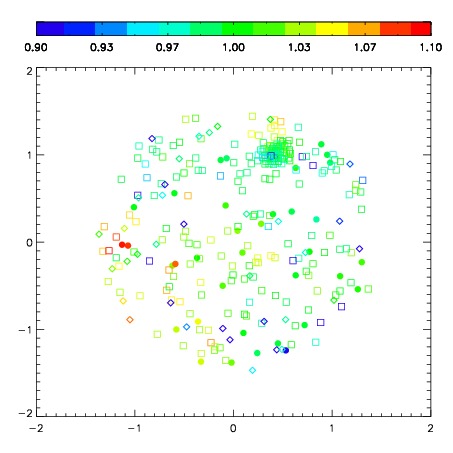
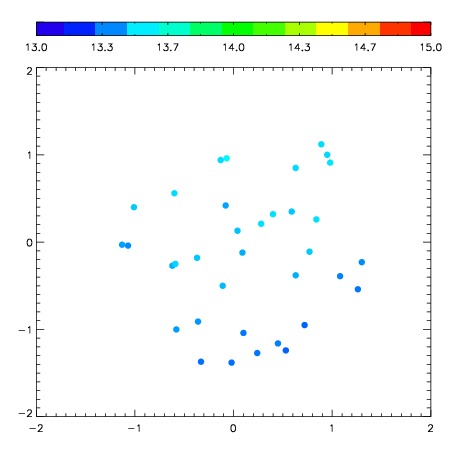
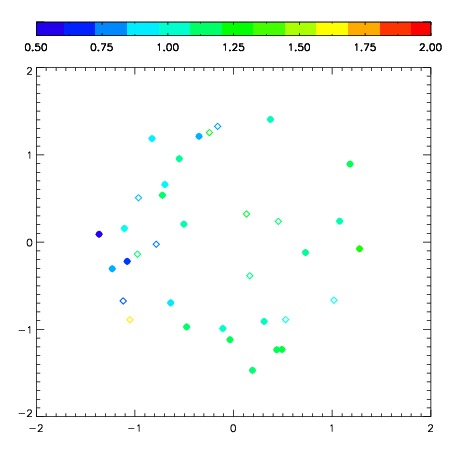
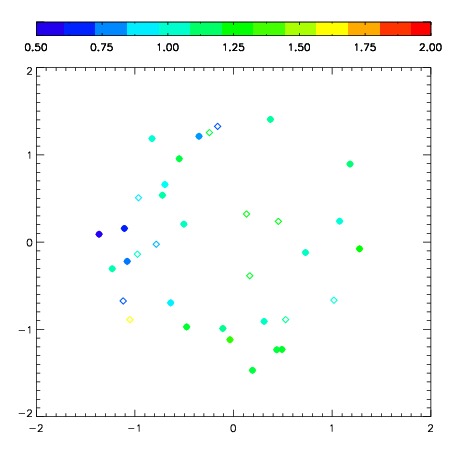
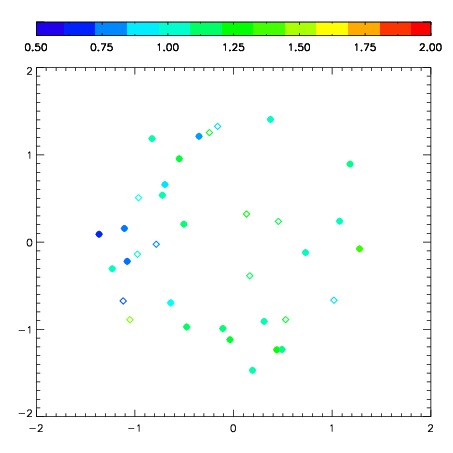
| Spatial sky 16325A emission deviations (filled: sky, open: star)
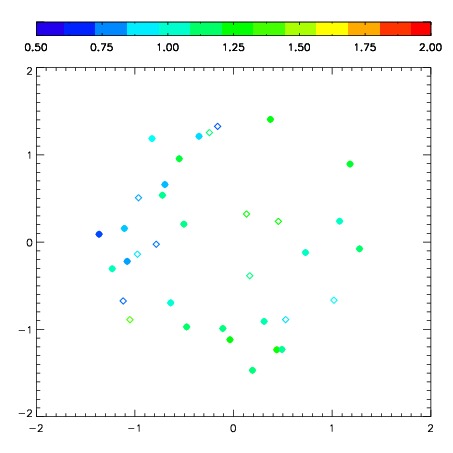
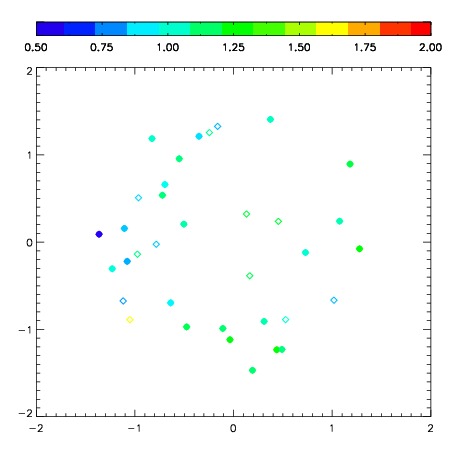
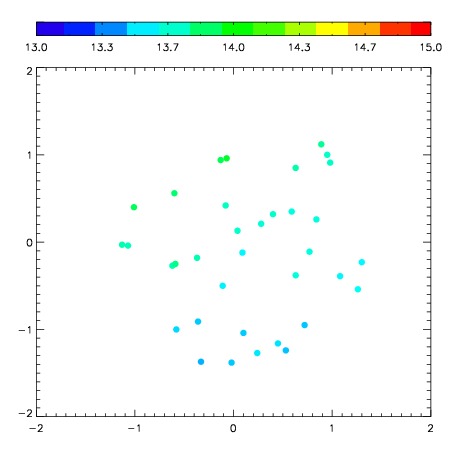
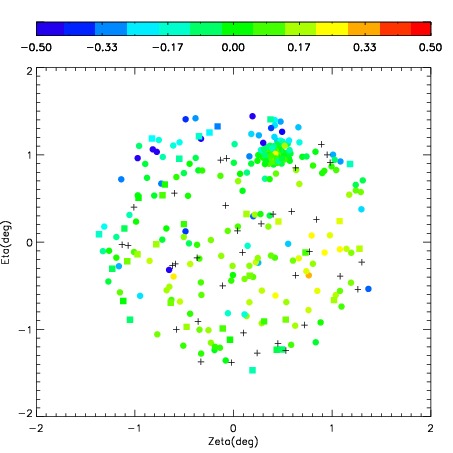
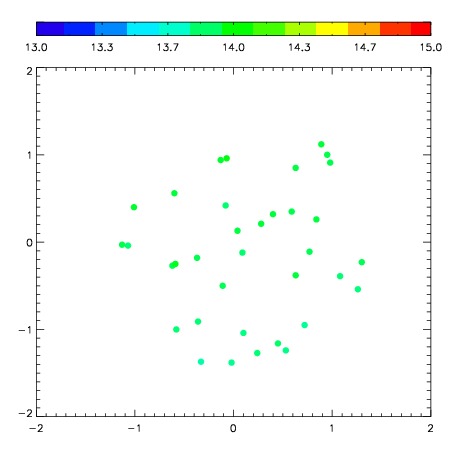
| Spatial sky continuum emission
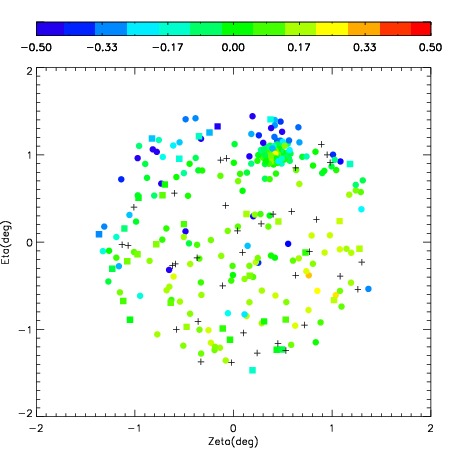
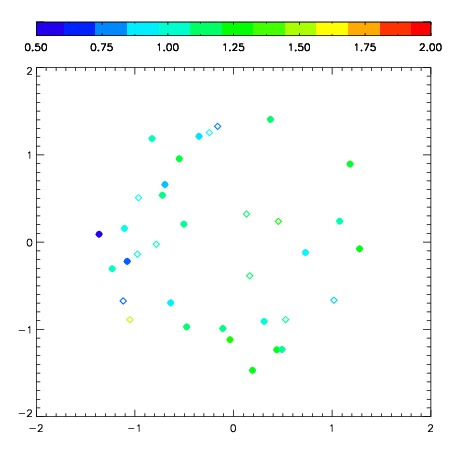
| Spatial sky telluric CO2 absorption deviations (filled: H < 10)
|
| 4910047
| 47
| | Red | Green | Blue
| | z | | 18.69
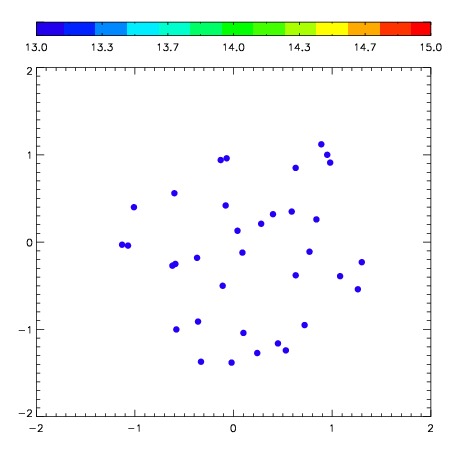
| | znorm | | 14.51
| | sky | 12.4 | 12.3 | 12.3
| | S/N | 10.1 | 16.3 | 20.0
| | S/N(c) | 9.5 | 15.3 | 18.1
| | SN(E/C) 0.37
|
| 
| 
| 
| 
| 
|
| 4910048
| 47
| | Red | Green | Blue
| | z | | 18.90
| | znorm | | 14.72
| | sky | 13.0 | 12.9 | 12.8
| | S/N | 12.5 | 20.0 | 23.8
| | S/N(c) | 11.4 | 18.6 | 22.5
| | SN(E/C) 0.38
|
| 
| 
| 
| 
| 
|
| 4910049
| 47
| | Red | Green | Blue
| | z | | 19.09
| | znorm | | 14.91
| | sky | 14.0 | 13.8 | 13.9
| | S/N | 15.1 | 24.3 | 28.0
| | S/N(c) | 13.6 | 23.3 | 27.0
| | SN(E/C) 0.33
|
| 
| 
| 
| 
| 
|
| 4910050
| 47
| | Red | Green | Blue
| | z | | 19.05
| | znorm | | 14.87
| | sky | 13.5 | 13.4 | 13.4
| | S/N | 14.6 | 23.2 | 26.4
| | S/N(c) | 13.2 | 21.8 | 25.5
| | SN(E/C) 0.30
|
| 
| 
| 
| 
| 
|
| 4910051
| 47
| | Red | Green | Blue
| | z | | 19.03
| | znorm | | 14.84
| | sky | 13.8 | 13.6 | 13.5
| | S/N | 14.1 | 23.2 | 26.2
| | S/N(c) | 12.8 | 22.6 | 25.6
| | SN(E/C) 0.32
|
| 
| 
| 
| 
| 
|
| 4910052
| 47
| | Red | Green | Blue
| | z | | 19.03
| | znorm | | 14.85
| | sky | 13.9 | 13.8 | 13.9
| | S/N | 14.4 | 24.0 | 26.7
| | S/N(c) | 12.9 | 22.6 | 25.5
| | SN(E/C) 0.34
|
| 
| 
| 
| 
| 
|
| 4910053
| 47
| | Red | Green | Blue
| | z | | 18.79
| | znorm | | 14.61
| | sky | 13.9 | 14.0 | 13.9
| | S/N | 12.2 | 21.0 | 23.3
| | S/N(c) | 10.6 | 19.7 | 22.2
| | SN(E/C) 0.40
|
| 
| 
| 
| 
| 
|
| 4910054
| 47
| | Red | Green | Blue
| | z | | 18.93
| | znorm | | 14.75
| | sky | 13.9 | 13.8 | 13.8
| | S/N | 13.3 | 22.5 | 25.0
| | S/N(c) | 11.9 | 21.1 | 23.6
| | SN(E/C) 0.35
|
| 
| 
| 
| 
| 
|