| Frame | Nreads | Zeropoints | Mag plots
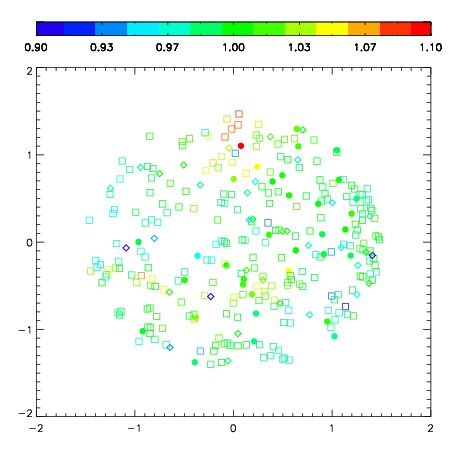
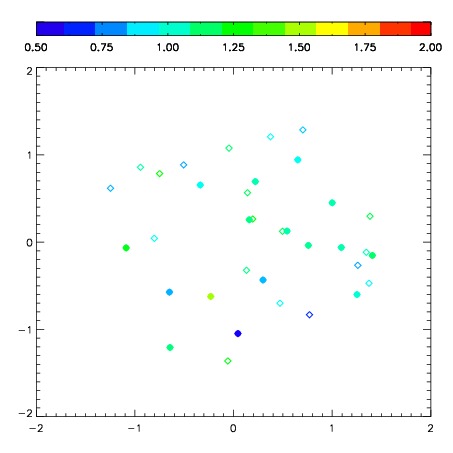
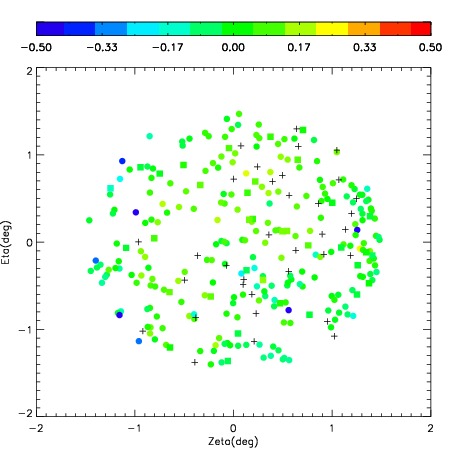
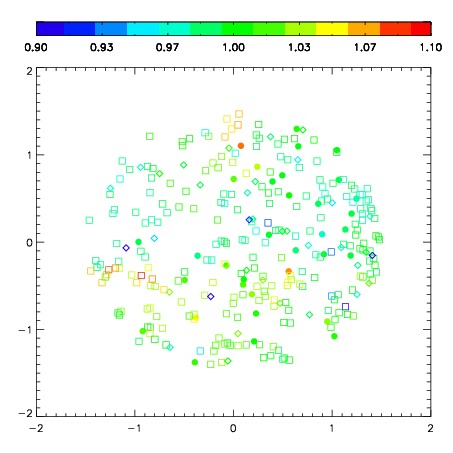
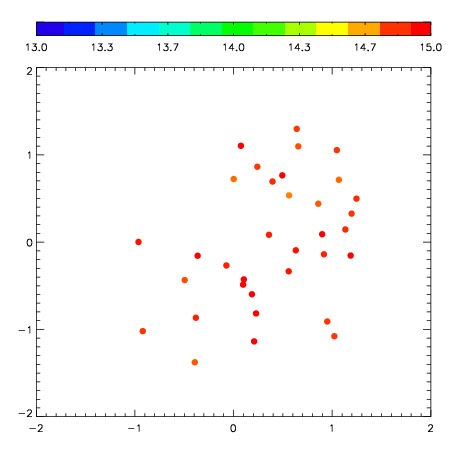
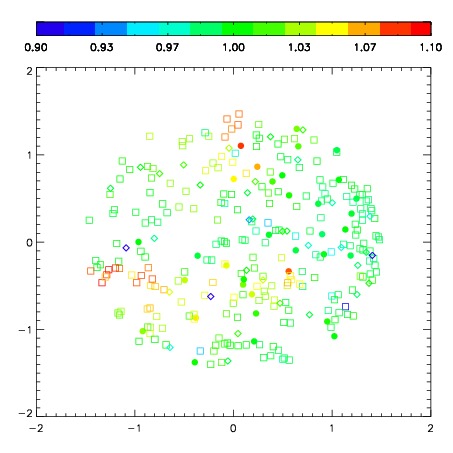
| Spatial mag deviation
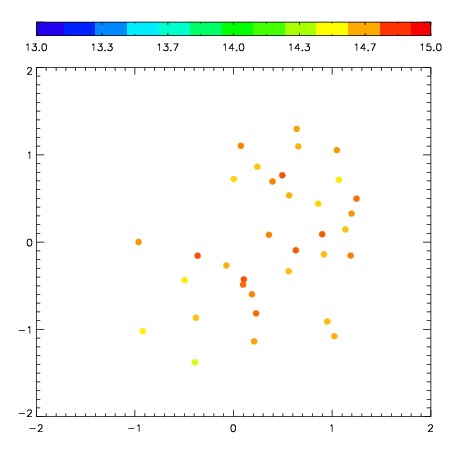
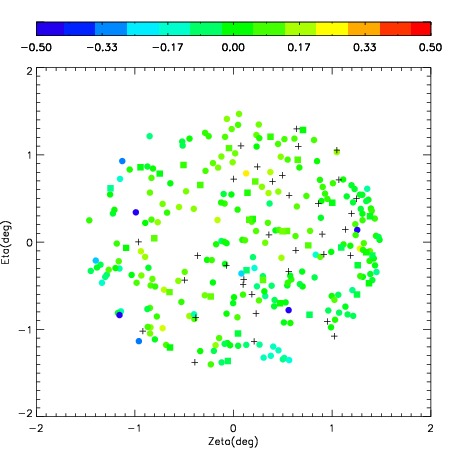
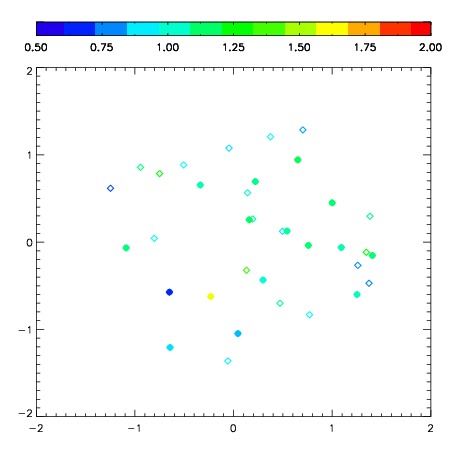
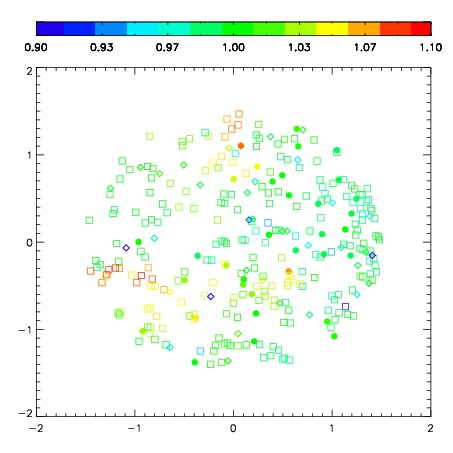
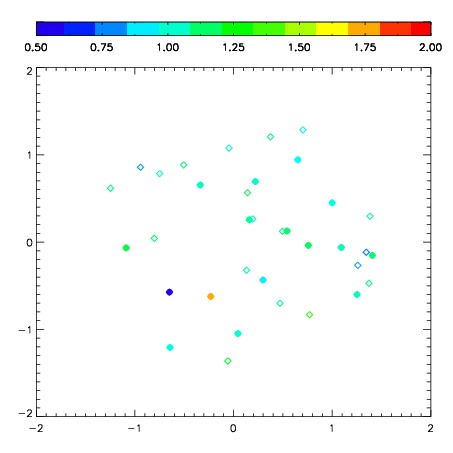
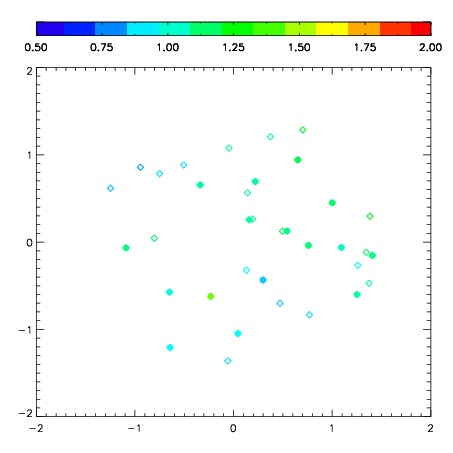
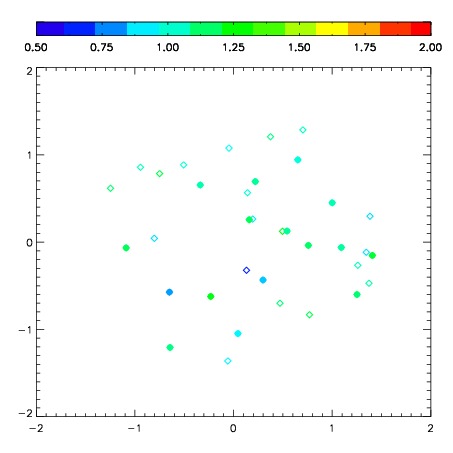
| Spatial sky 16325A emission deviations (filled: sky, open: star)
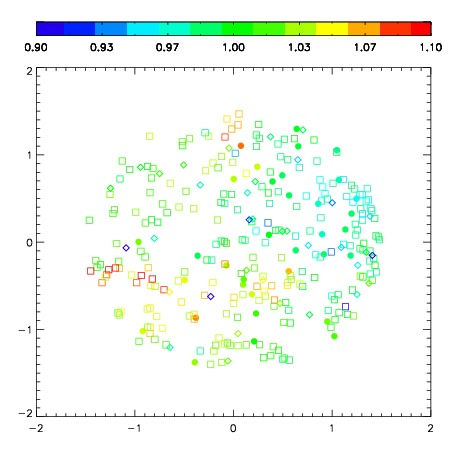
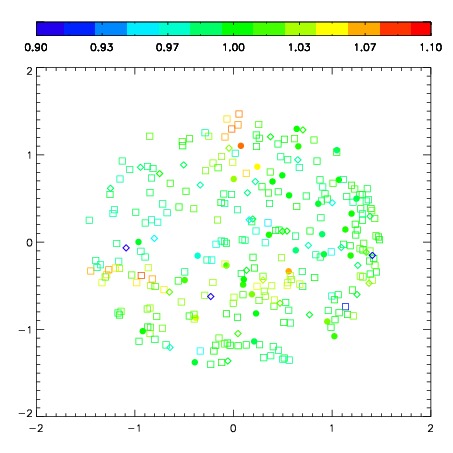
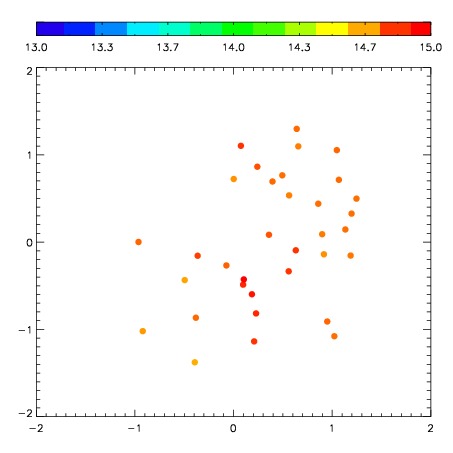
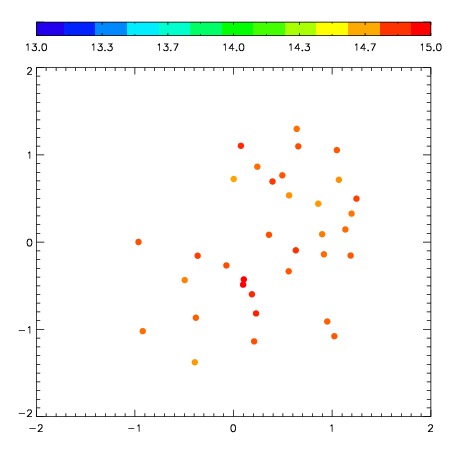
| Spatial sky continuum emission
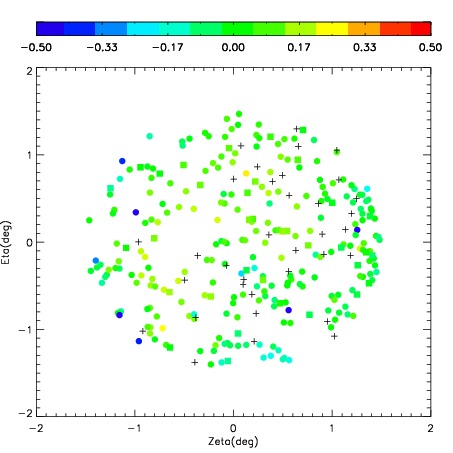
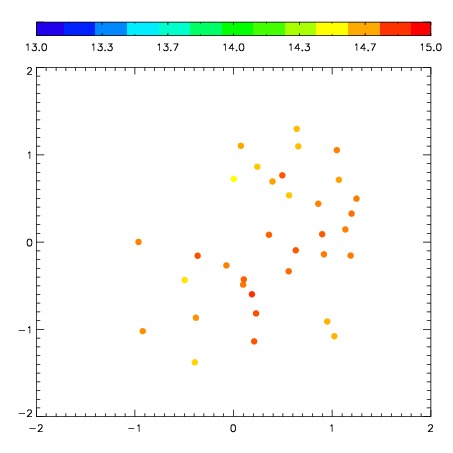
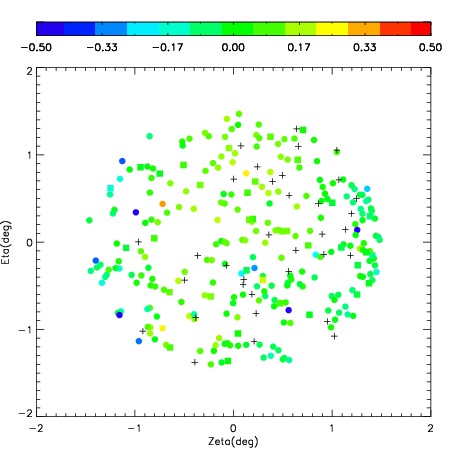
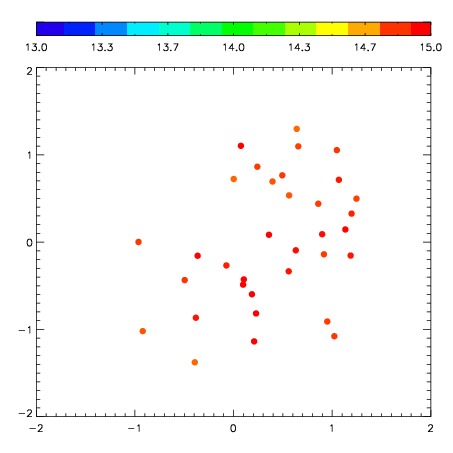
| Spatial sky telluric CO2 absorption deviations (filled: H < 10)
|
| 5210048
| 47
| | Red | Green | Blue
| | z | | 18.10
| | znorm | | 13.92
| | sky | 14.8 | 14.3 | 14.4
| | S/N | 8.3 | 13.6 | 17.6
| | S/N(c) | 7.3 | 12.5 | 16.5
| | SN(E/C) 0.71
|
| 
| 
| 
| 
| 
|
| 5210049
| 47
| | Red | Green | Blue
| | z | | 18.07
| | znorm | | 13.89
| | sky | 14.8 | 14.6 | 14.9
| | S/N | 7.7 | 13.7 | 17.2
| | S/N(c) | 6.6 | 12.6 | 16.1
| | SN(E/C) 0.69
|
| 
| 
| 
| 
| 
|
| 5210050
| 47
| | Red | Green | Blue
| | z | | 17.79
| | znorm | | 13.61
| | sky | 15.0 | 14.6 | 14.9
| | S/N | 6.1 | 11.1 | 14.8
| | S/N(c) | 5.4 | 9.9 | 13.7
| | SN(E/C) 0.77
|
| 
| 
| 
| 
| 
|
| 5210051
| 47
| | Red | Green | Blue
| | z | | 17.86
| | znorm | | 13.68
| | sky | 14.7 | 14.7 | 15.0
| | S/N | 6.5 | 11.8 | 14.9
| | S/N(c) | 5.8 | 10.7 | 13.9
| | SN(E/C) 0.80
|
| 
| 
| 
| 
| 
|
| 5210052
| 47
| | Red | Green | Blue
| | z | | 18.08
| | znorm | | 13.90
| | sky | 14.8 | 14.7 | 15.1
| | S/N | 8.0 | 13.7 | 16.5
| | S/N(c) | 7.0 | 12.6 | 15.4
| | SN(E/C) 0.76
|
| 
| 
| 
| 
| 
|
| 5210053
| 47
| | Red | Green | Blue
| | z | | 17.98
| | znorm | | 13.80
| | sky | 14.9 | 14.8 | 15.0
| | S/N | 7.4 | 13.1 | 15.7
| | S/N(c) | 6.4 | 12.0 | 14.8
| | SN(E/C) 0.76
|
| 
| 
| 
| 
| 
|
| 5210054
| 47
| | Red | Green | Blue
| | z | | 17.92
| | znorm | | 13.74
| | sky | 14.8 | 14.9 | 15.2
| | S/N | 7.0 | 12.5 | 15.4
| | S/N(c) | 6.1 | 11.4 | 14.4
| | SN(E/C) 0.77
|
| 
| 
| 
| 
| 
|
| 5210055
| 47
| | Red | Green | Blue
| | z | | 18.02
| | znorm | | 13.84
| | sky | 15.0 | 14.8 | 15.1
| | S/N | 7.9 | 13.4 | 16.0
| | S/N(c) | 6.8 | 12.3 | 14.9
| | SN(E/C) 0.74
|
| 
| 
| 
| 
| 
|