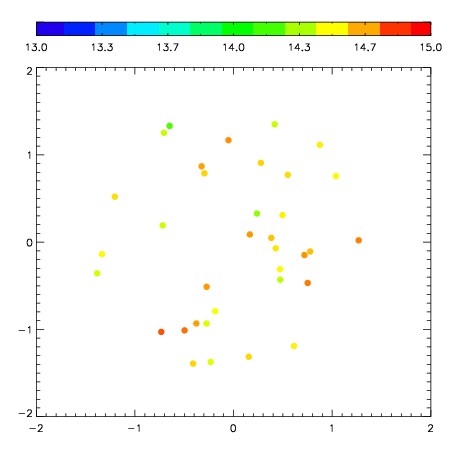
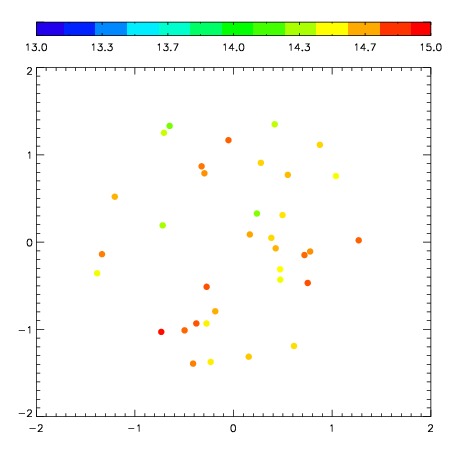
| Frame | Nreads | Zeropoints | Mag plots
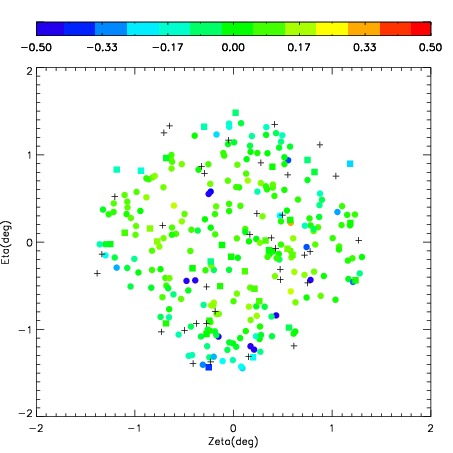
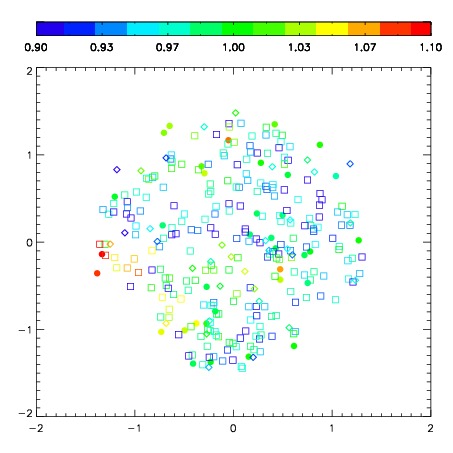
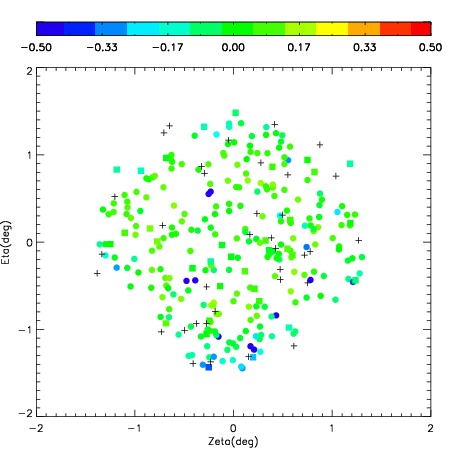
| Spatial mag deviation
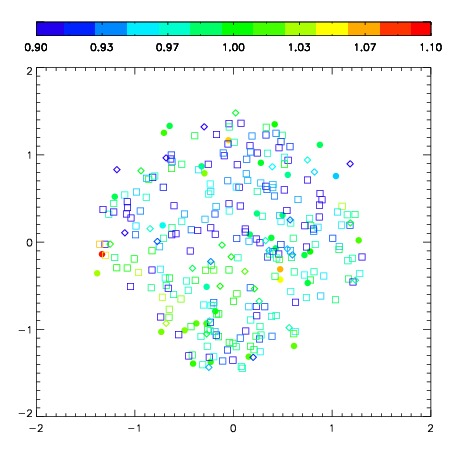
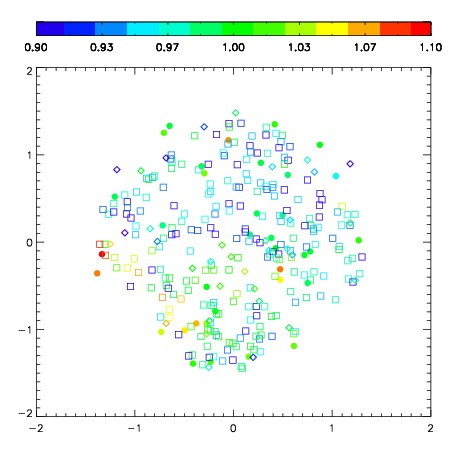
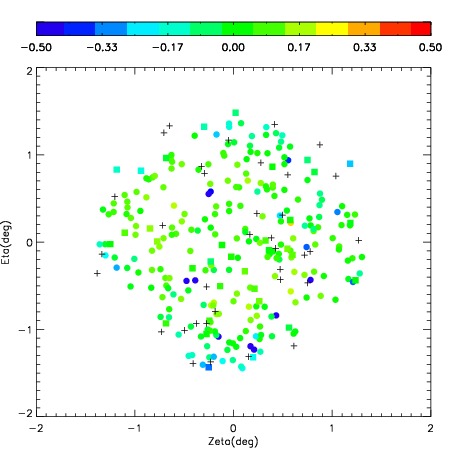
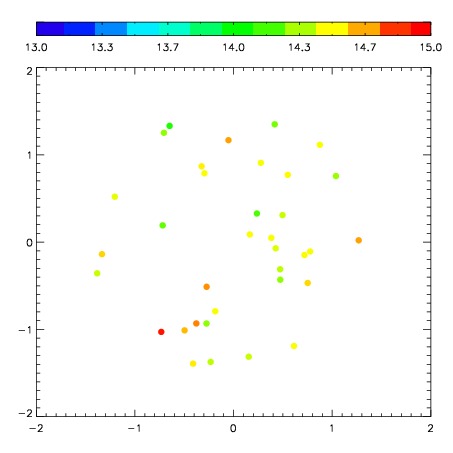
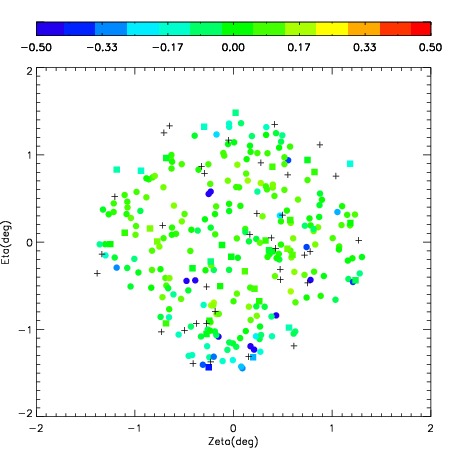
| Spatial sky 16325A emission deviations (filled: sky, open: star)
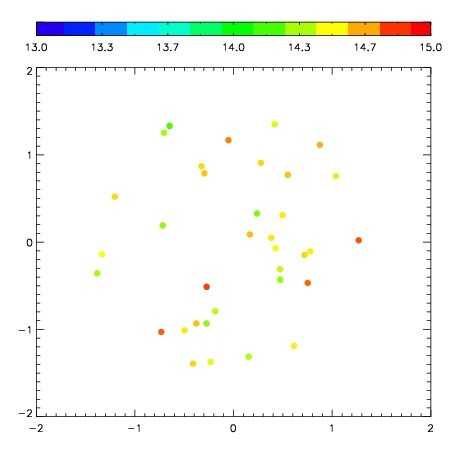
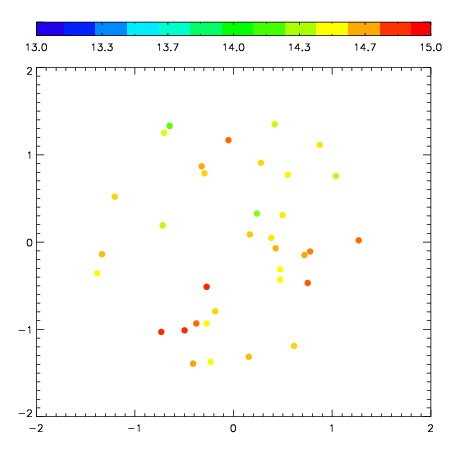
| Spatial sky continuum emission
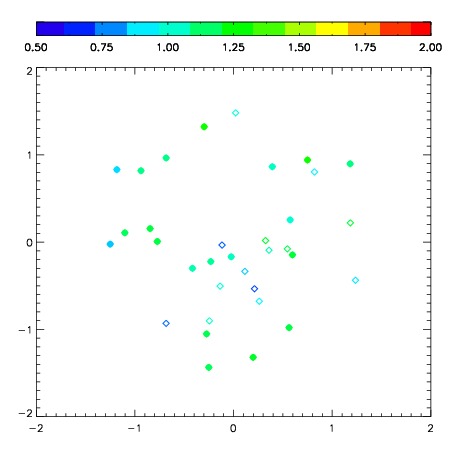
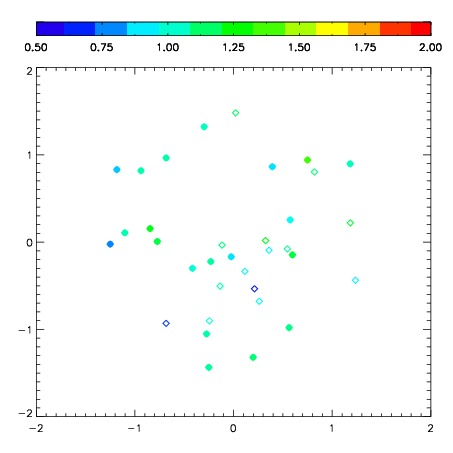
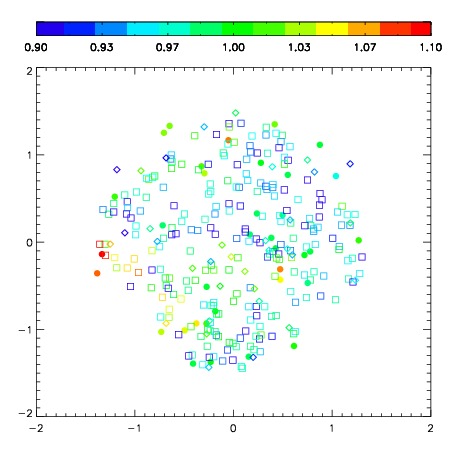
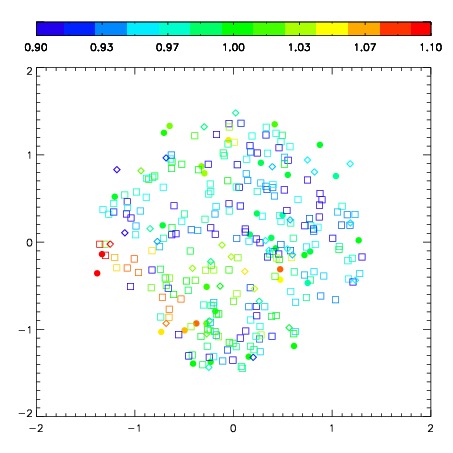
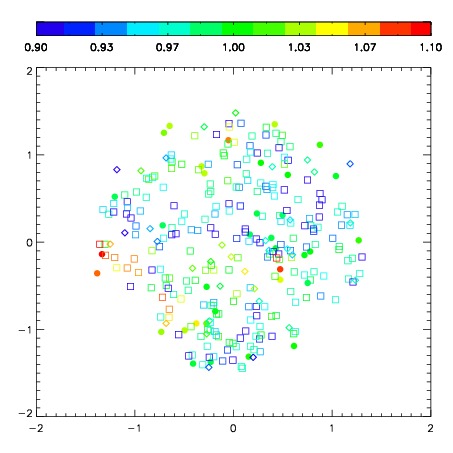
| Spatial sky telluric CO2 absorption deviations (filled: H < 10)
|
| 8760063
| 47
| | Red | Green | Blue
| | z | | 18.60
| | znorm | | 14.42
| | sky | 14.8 | 14.4 | 14.4
| | S/N | 14.2 | 20.8 | 23.6
| | S/N(c) | 13.1 | 20.0 | 22.8
| | SN(E/C) 0.88
|
| 
| 
| 
| 
| 
|
| 8760064
| 47
| | Red | Green | Blue
| | z | | 18.64
| | znorm | | 14.46
| | sky | 14.5 | 14.3 | 14.5
| | S/N | 14.4 | 21.3 | 24.3
| | S/N(c) | 13.4 | 20.4 | 23.3
| | SN(E/C) 0.88
|
| 
| 
| 
| 
| 
|
| 8760065
| 47
| | Red | Green | Blue
| | z | | 18.66
| | znorm | | 14.48
| | sky | 14.6 | 14.5 | 14.5
| | S/N | 14.6 | 21.6 | 24.6
| | S/N(c) | 13.4 | 20.6 | 23.7
| | SN(E/C) 0.92
|
| 
| 
| 
| 
| 
|
| 8760066
| 47
| | Red | Green | Blue
| | z | | 18.69
| | znorm | | 14.51
| | sky | 14.7 | 14.4 | 14.5
| | S/N | 14.8 | 21.8 | 24.8
| | S/N(c) | 13.7 | 20.9 | 23.9
| | SN(E/C) 0.87
|
| 
| 
| 
| 
| 
|
| 8760067
| 47
| | Red | Green | Blue
| | z | | 18.72
| | znorm | | 14.54
| | sky | 14.5 | 14.4 | 14.4
| | S/N | 14.9 | 22.2 | 25.1
| | S/N(c) | 13.8 | 21.4 | 24.2
| | SN(E/C) 0.89
|
| 
| 
| 
| 
| 
|
| 8760068
| 47
| | Red | Green | Blue
| | z | | 18.56
| | znorm | | 14.38
| | sky | 14.7 | 14.5 | 14.5
| | S/N | 13.6 | 20.3 | 23.1
| | S/N(c) | 12.4 | 19.4 | 22.3
| | SN(E/C) 0.89
|
| 
| 
| 
| 
| 
|
| 8760069
| 47
| | Red | Green | Blue
| | z | | 18.62
| | znorm | | 14.44
| | sky | 14.6 | 14.5 | 14.4
| | S/N | 14.0 | 21.2 | 23.7
| | S/N(c) | 13.0 | 20.3 | 22.9
| | SN(E/C) 0.90
|
| 
| 
| 
| 
| 
|
| 8760070
| 47
| | Red | Green | Blue
| | z | | 18.56
| | znorm | | 14.38
| | sky | 14.7 | 14.5 | 14.5
| | S/N | 13.6 | 20.6 | 22.8
| | S/N(c) | 12.6 | 19.6 | 22.1
| | SN(E/C) 0.93
|
| 
| 
| 
| 
| 
|