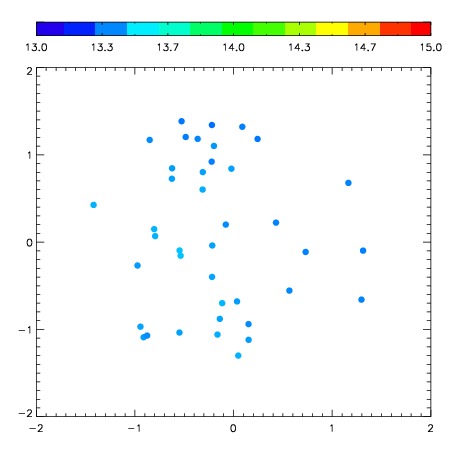
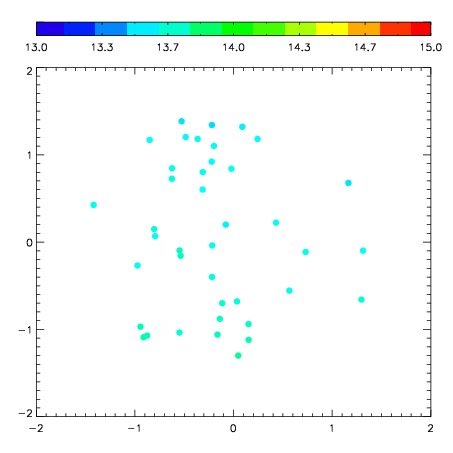
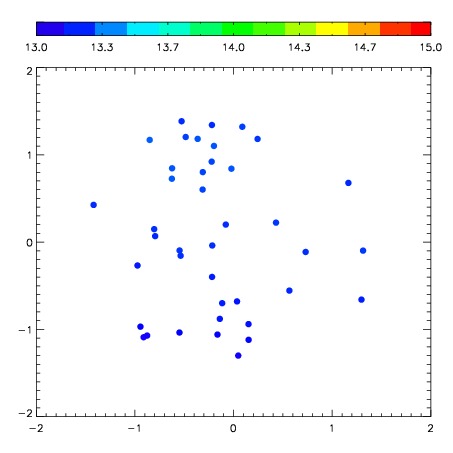
| Frame | Nreads | Zeropoints | Mag plots
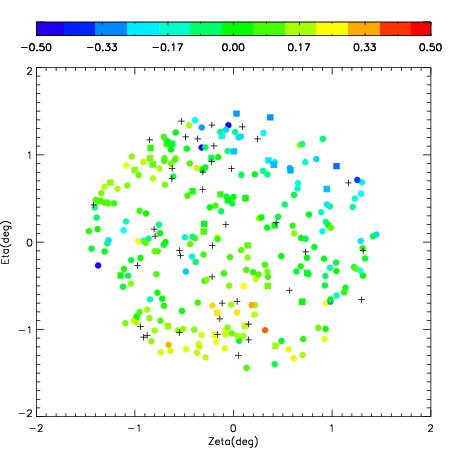
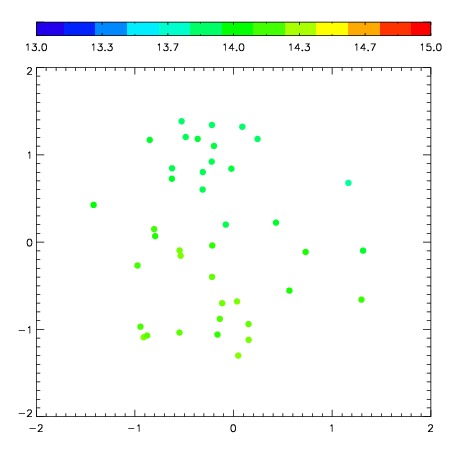
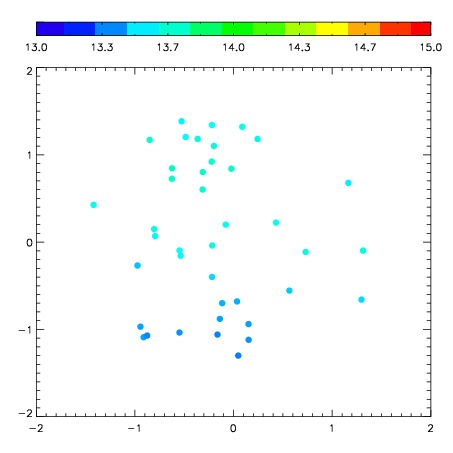
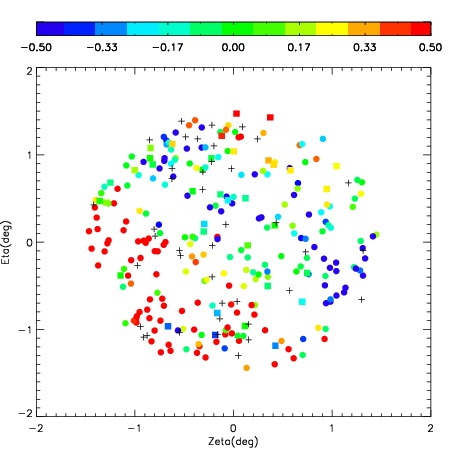
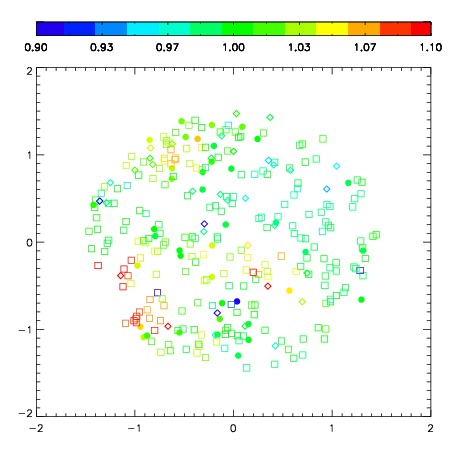
| Spatial mag deviation
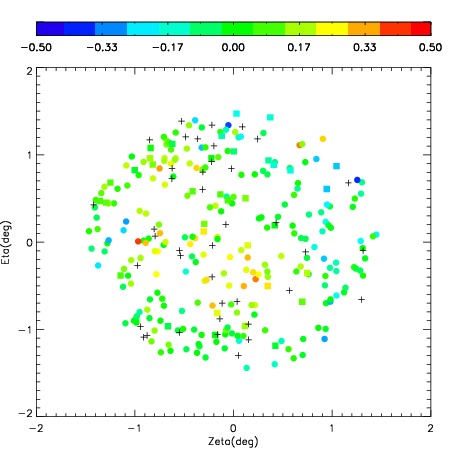
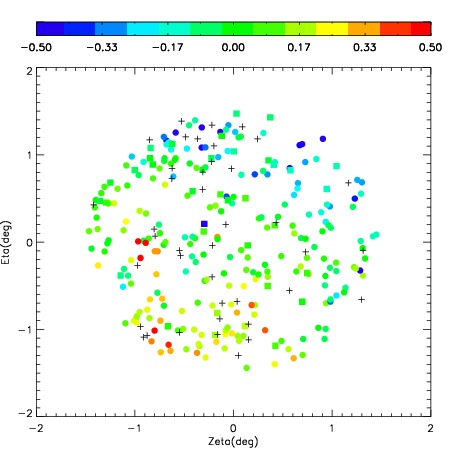
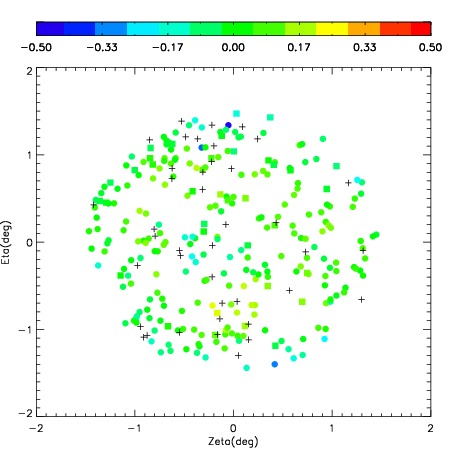
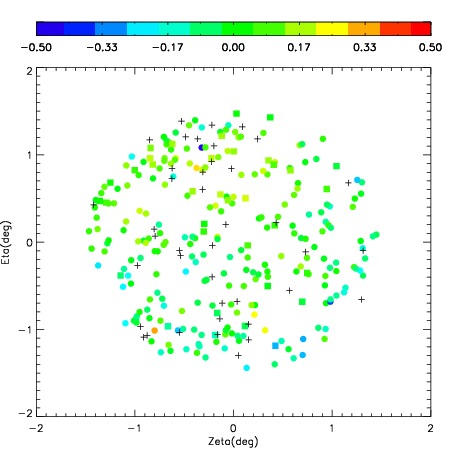
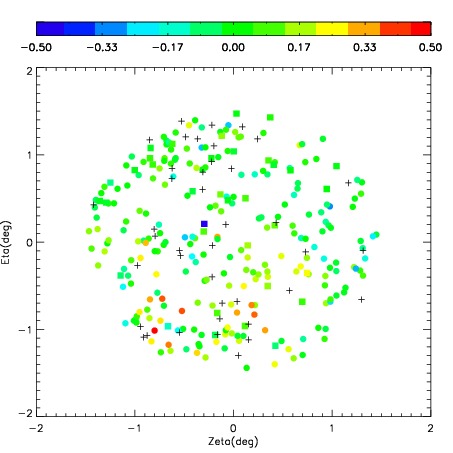
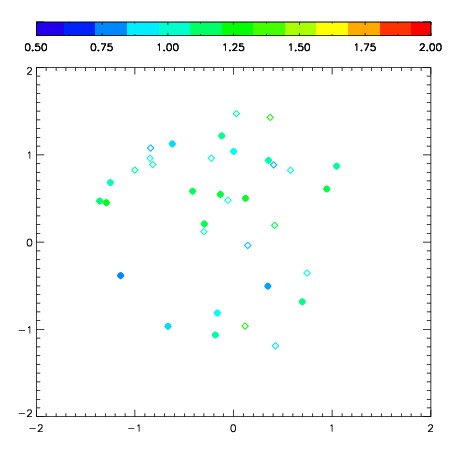
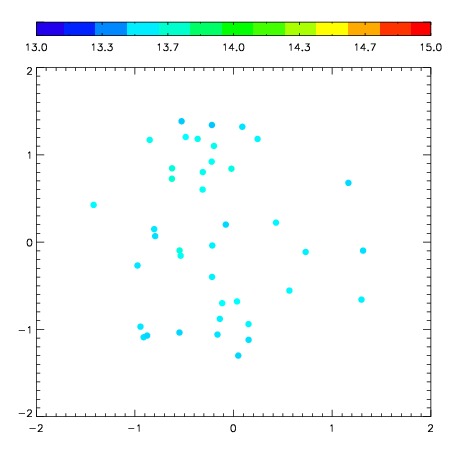
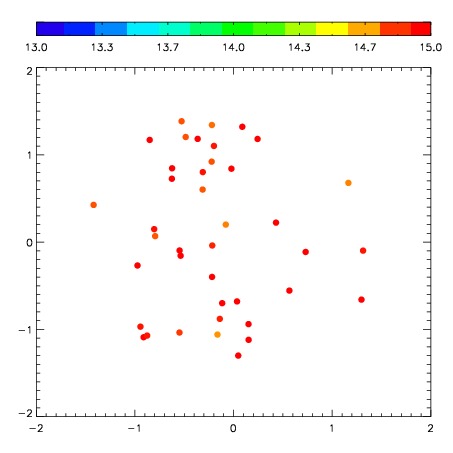
| Spatial sky 16325A emission deviations (filled: sky, open: star)
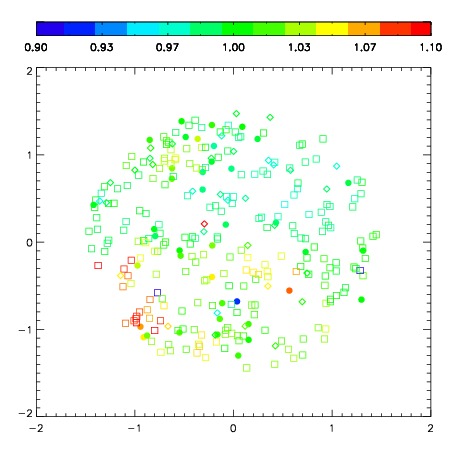
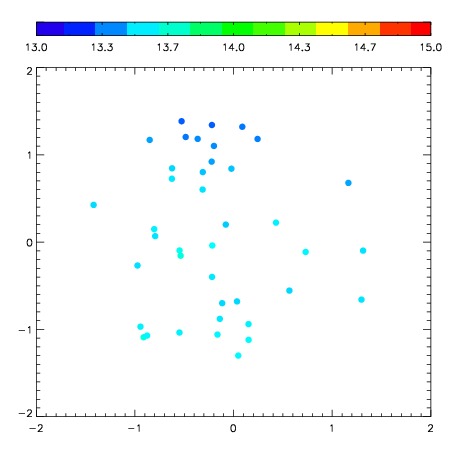
| Spatial sky continuum emission
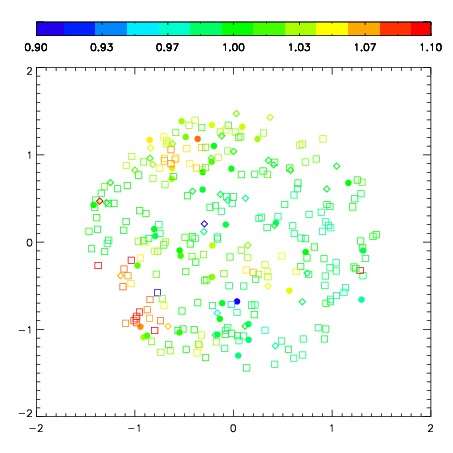
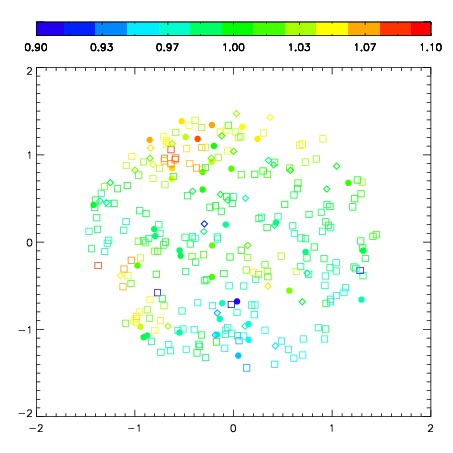
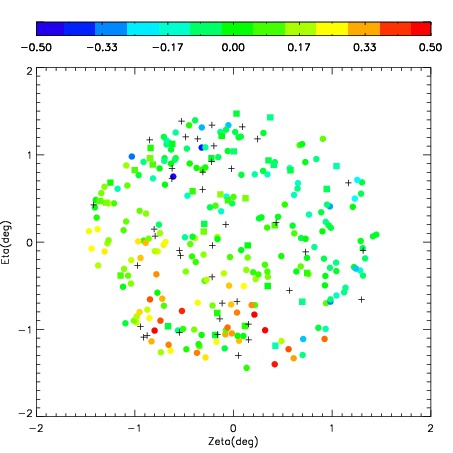
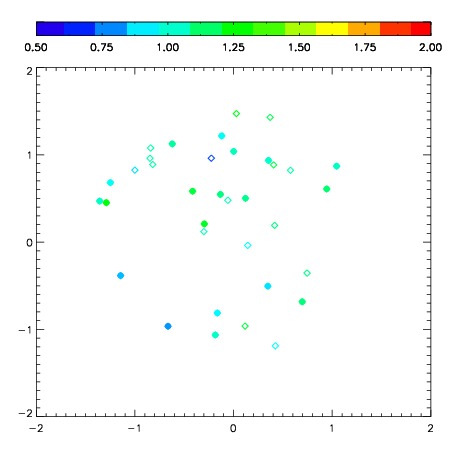
| Spatial sky telluric CO2 absorption deviations (filled: H < 10)
|
| 6110080
| 47
| | Red | Green | Blue
| | z | | 17.36
| | znorm | | 13.18
| | sky | 13.1 | 13.1 | 13.0
| | S/N | 3.6 | 6.9 | 7.1
| | S/N(c) | 3.2 | 6.3 | 6.6
| | SN(E/C) 0.94
|
| 
| 
| 
| 
| 
|
| 6110081
| 47
| | Red | Green | Blue
| | z | | 16.77
| | znorm | | 12.59
| | sky | 12.9 | 12.8 | 13.0
| | S/N | 2.4 | 3.8 | 5.5
| | S/N(c) | 2.0 | 3.5 | 4.3
| | SN(E/C) 1.09
|
| 
| 
| 
| 
| 
|
| 6110082
| 47
| | Red | Green | Blue
| | z | | 17.08
| | znorm | | 12.90
| | sky | 13.3 | 13.3 | 13.5
| | S/N | 2.7 | 5.5 | 7.5
| | S/N(c) | 2.4 | 5.2 | 6.6
| | SN(E/C) 1.08
|
| 
| 
| 
| 
| 
|
| 6110083
| 47
| | Red | Green | Blue
| | z | | 18.26
| | znorm | | 14.08
| | sky | 13.6 | 13.6 | 13.7
| | S/N | 8.6 | 14.5 | 16.1
| | S/N(c) | 7.6 | 13.5 | 15.0
| | SN(E/C) 0.92
|
| 
| 
| 
| 
| 
|
| 6110084
| 47
| | Red | Green | Blue
| | z | | 17.49
| | znorm | | 13.31
| | sky | 13.2 | 13.1 | 13.3
| | S/N | 4.4 | 8.2 | 9.5
| | S/N(c) | 3.9 | 7.5 | 9.4
| | SN(E/C) 0.98
|
| 
| 
| 
| 
| 
|
| 6110085
| 47
| | Red | Green | Blue
| | z | | 16.96
| | znorm | | 12.78
| | sky | 13.2 | 13.2 | 13.3
| | S/N | 2.8 | 5.4 | 5.8
| | S/N(c) | 2.6 | 4.8 | 5.3
| | SN(E/C) 1.04
|
| 
| 
| 
| 
| 
|
| 6110086
| 47
| | Red | Green | Blue
| | z | | 18.52
| | znorm | | 14.34
| | sky | 14.0 | 14.0 | 14.1
| | S/N | 10.3 | 18.1 | 18.6
| | S/N(c) | 9.0 | 16.4 | 17.6
| | SN(E/C) 0.91
|
| 
| 
| 
| 
| 
|
| 6110087
| 47
| | Red | Green | Blue
| | z | | 17.26
| | znorm | | 13.08
| | sky | 13.5 | 13.5 | 13.6
| | S/N | 3.6 | 7.1 | 7.7
| | S/N(c) | 3.0 | 6.6 | 6.8
| | SN(E/C) 0.99
|
| 
| 
| 
| 
| 
|
| 6110088
| 47
| | Red | Green | Blue
| | z | | 18.13
| | znorm | | 13.95
| | sky | 13.5 | 13.5 | 13.6
| | S/N | 7.3 | 13.0 | 14.1
| | S/N(c) | 6.4 | 12.0 | 13.1
| | SN(E/C) 0.95
|
| 
| 
| 
| 
| 
|
| 6110089
| 47
| | Red | Green | Blue
| | z | | 15.28
| | znorm | | 11.10
| | sky | 13.0 | 13.1 | 13.1
| | S/N | 0.8 | 1.3 | 2.3
| | S/N(c) | 0.7 | 1.4 | 1.9
| | SN(E/C) 1.05
|
| 
| 
| 
| 
| 
|
| 6110090
| 47
| | Red | Green | Blue
| | z | | 18.82
| | znorm | | 14.64
| | sky | 14.7 | 14.9 | 15.5
| | S/N | 13.2 | 22.3 | 23.8
| | S/N(c) | 12.0 | 21.1 | 22.7
| | SN(E/C) 0.93
|
| 
| 
| 
| 
| 
|
| 6110091
| 47
| | Red | Green | Blue
| | z | | 18.07
| | znorm | | 13.89
| | sky | 13.5 | 13.5 | 13.5
| | S/N | 6.8 | 12.8 | 13.1
| | S/N(c) | 5.9 | 11.8 | 13.1
| | SN(E/C) 0.97
|
| 
| 
| 
| 
| 
|