| Red | Green | Blue | |
| z | 17.64 | ||
| znorm | Inf | ||
| sky | -Inf | -Inf | -Inf |
| S/N | 28.1 | 47.0 | 51.4 |
| S/N(c) | 0.0 | 0.0 | 0.0 |
| SN(E/C) |
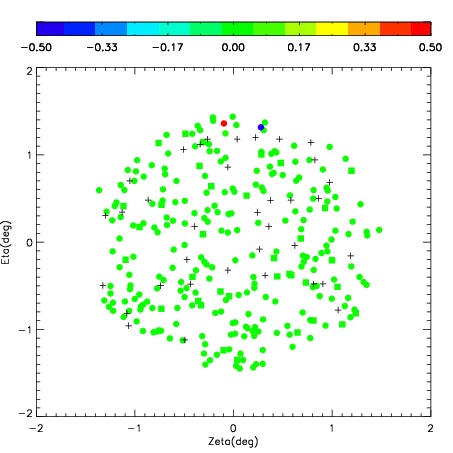
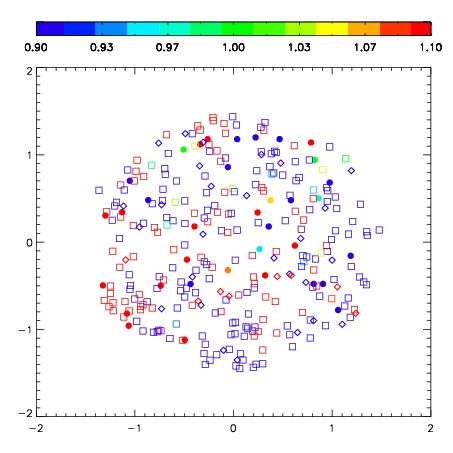
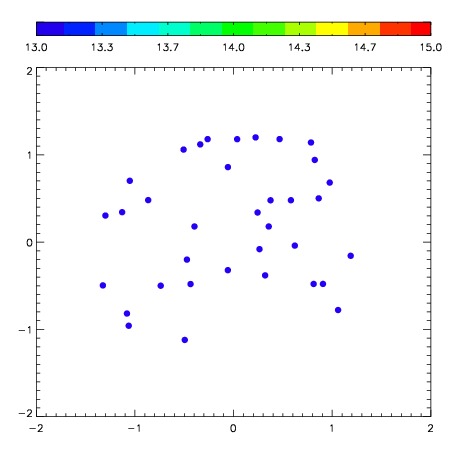
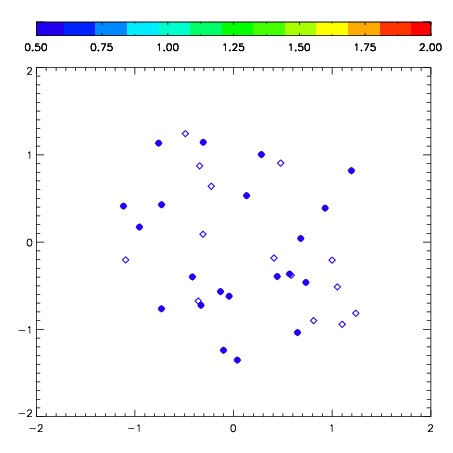
| Frame | Nreads | Zeropoints | Mag plots | Spatial mag deviation | Spatial sky 16325A emission deviations (filled: sky, open: star) | Spatial sky continuum emission | Spatial sky telluric CO2 absorption deviations (filled: H < 10) | |||||||||||||||||||||||
| 0 | 0 |
|
|
|
|
|
|
| IPAIR | NAME | SHIFT | NEWSHIFT | S/N | NAME | SHIFT | NEWSHIFT | S/N |
| 0 | 07230068 | 0.285386 | 0.00000 | 258.847 | 07230070 | -0.0287046 | 0.314091 | 250.398 |
| 1 | 07230061 | 0.283253 | 0.00213298 | 268.552 | 07230063 | -0.0108557 | 0.296242 | 272.208 |
| 2 | 07230065 | 0.270267 | 0.0151190 | 267.629 | 07230066 | -0.0180486 | 0.303435 | 268.253 |
| 3 | 07230064 | 0.281030 | 0.00435600 | 264.423 | 07230067 | -0.0151687 | 0.300555 | 266.901 |
| 4 | 07230069 | 0.279955 | 0.00543100 | 262.198 | 07230062 | -0.0151238 | 0.300510 | 265.059 |
| 5 | 07230060 | 0.280702 | 0.00468400 | 255.529 | 07230059 | 0.00000 | 0.285386 | 244.990 |