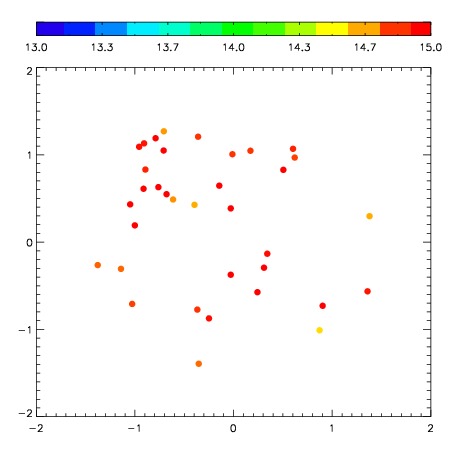
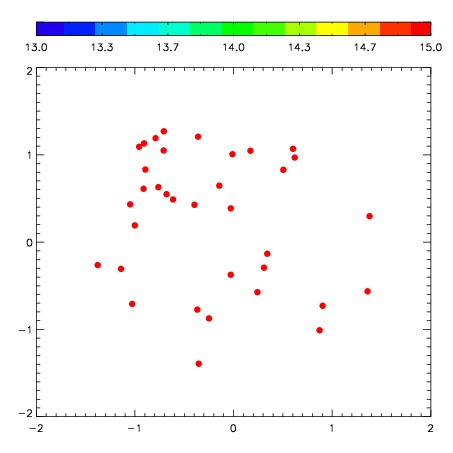
| Frame | Nreads | Zeropoints | Mag plots
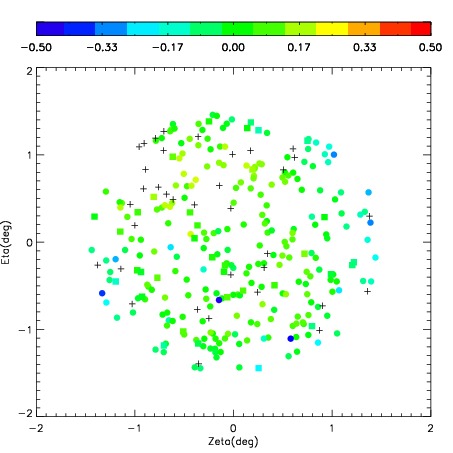
| Spatial mag deviation
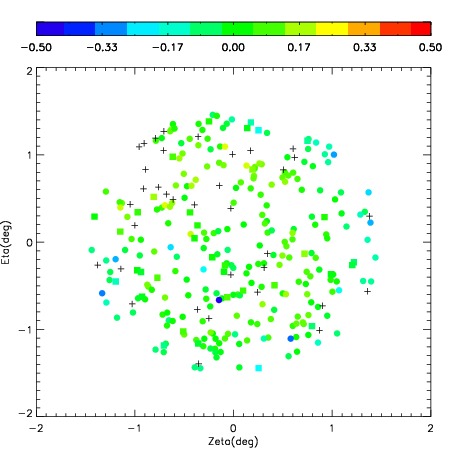
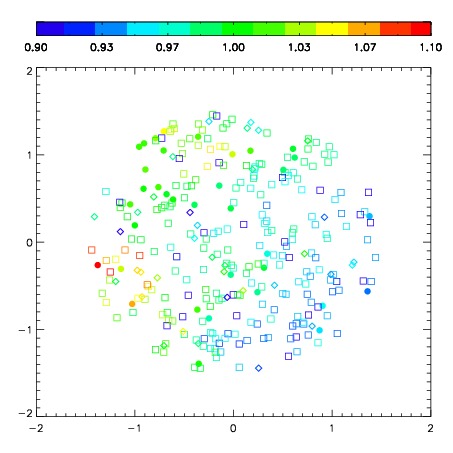
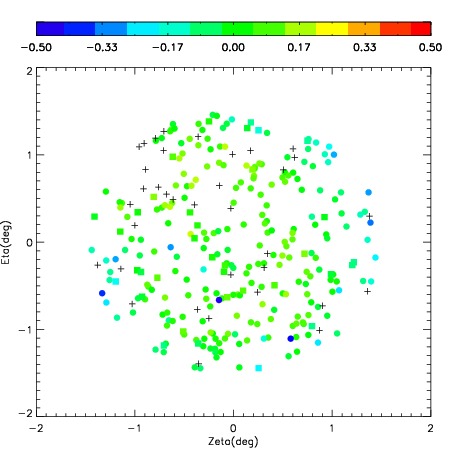
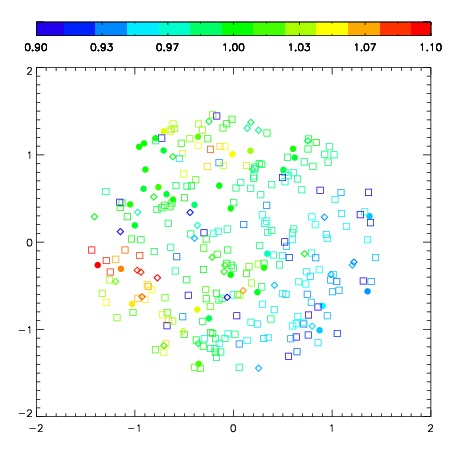
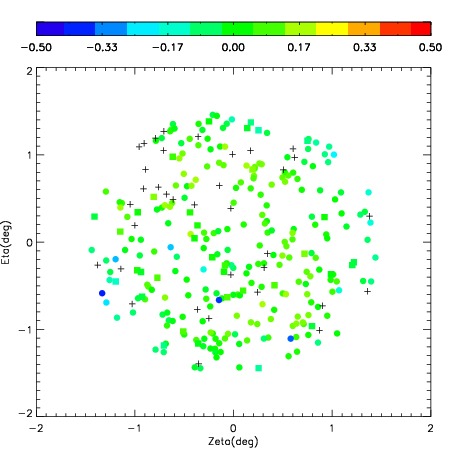
| Spatial sky 16325A emission deviations (filled: sky, open: star)
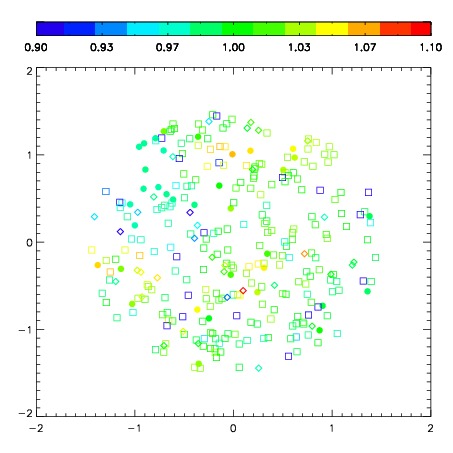
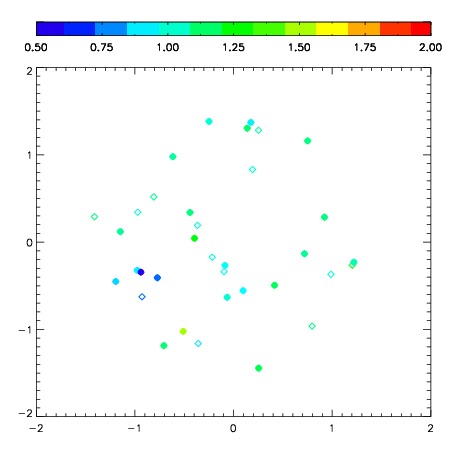
| Spatial sky continuum emission
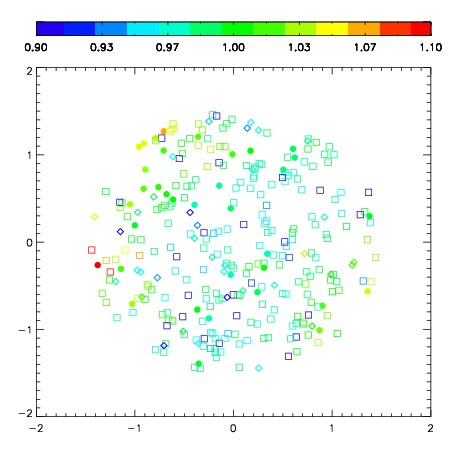
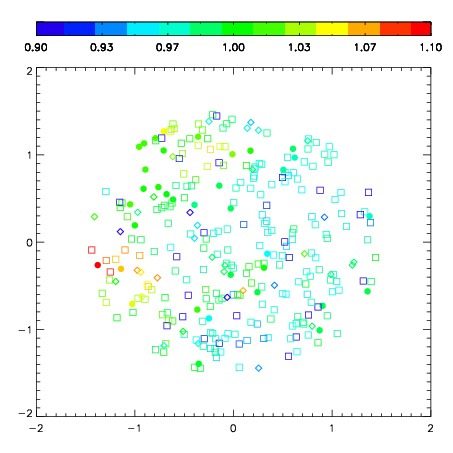
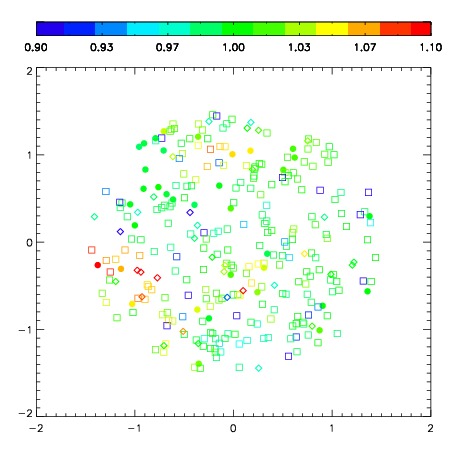
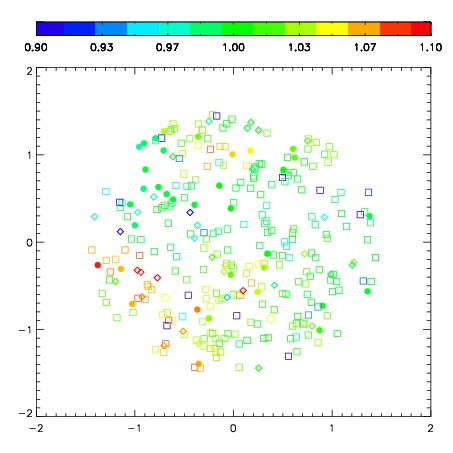
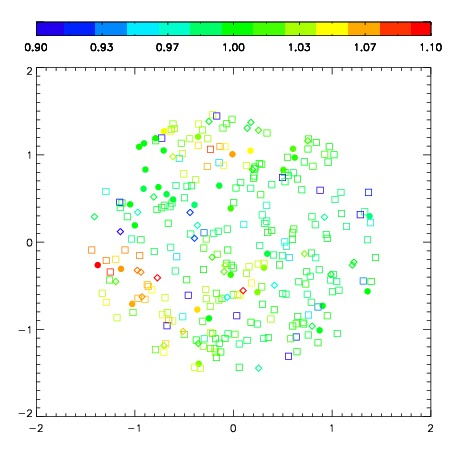
| Spatial sky telluric CO2 absorption deviations (filled: H < 10)
|
| 7610026
| 47
| | Red | Green | Blue
| | z | | 18.61
| | znorm | | 14.43
| | sky | 16.0 | 14.8 | 14.9
| | S/N | 11.6 | 20.0 | 21.3
| | S/N(c) | 10.3 | 18.9 | 20.3
| | SN(E/C) 0.98
|
| 
| 
| 
| 
| 
|
| 7610027
| 47
| | Red | Green | Blue
| | z | | 18.69
| | znorm | | 14.51
| | sky | 15.6 | 15.2 | 15.7
| | S/N | 12.0 | 20.5 | 22.9
| | S/N(c) | 10.7 | 19.3 | 21.8
| | SN(E/C) 0.98
|
| 
| 
| 
| 
| 
|
| 7610028
| 47
| | Red | Green | Blue
| | z | | 18.70
| | znorm | | 14.52
| | sky | 15.6 | 15.3 | 15.6
| | S/N | 12.0 | 20.8 | 22.8
| | S/N(c) | 10.7 | 19.6 | 21.7
| | SN(E/C) 0.97
|
| 
| 
| 
| 
| 
|
| 7610029
| 47
| | Red | Green | Blue
| | z | | 18.65
| | znorm | | 14.47
| | sky | 15.3 | 15.4 | 15.7
| | S/N | 11.6 | 20.5 | 22.1
| | S/N(c) | 10.3 | 19.2 | 21.1
| | SN(E/C) 1.01
|
| 
| 
| 
| 
| 
|
| 7610030
| 47
| | Red | Green | Blue
| | z | | 18.67
| | znorm | | 14.49
| | sky | 15.6 | 15.5 | 15.9
| | S/N | 11.7 | 20.5 | 21.8
| | S/N(c) | 10.6 | 19.2 | 20.7
| | SN(E/C) 1.00
|
| 
| 
| 
| 
| 
|
| 7610031
| 47
| | Red | Green | Blue
| | z | | 18.67
| | znorm | | 14.49
| | sky | 15.4 | 15.3 | 15.7
| | S/N | 11.6 | 20.7 | 22.0
| | S/N(c) | 10.3 | 19.3 | 20.9
| | SN(E/C) 0.97
|
| 
| 
| 
| 
| 
|
| 7610032
| 47
| | Red | Green | Blue
| | z | | 18.40
| | znorm | | 14.22
| | sky | 15.6 | 15.4 | 15.9
| | S/N | 10.0 | 17.9 | 19.0
| | S/N(c) | 8.7 | 16.7 | 17.9
| | SN(E/C) 1.01
|
| 
| 
| 
| 
| 
|
| 7610033
| 47
| | Red | Green | Blue
| | z | | 18.32
| | znorm | | 14.14
| | sky | 15.6 | 15.2 | 15.8
| | S/N | 9.2 | 17.3 | 18.0
| | S/N(c) | 8.2 | 16.0 | 17.0
| | SN(E/C) 1.02
|
| 
| 
| 
| 
| 
|