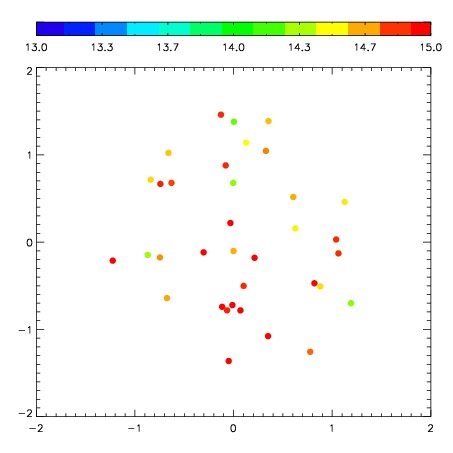
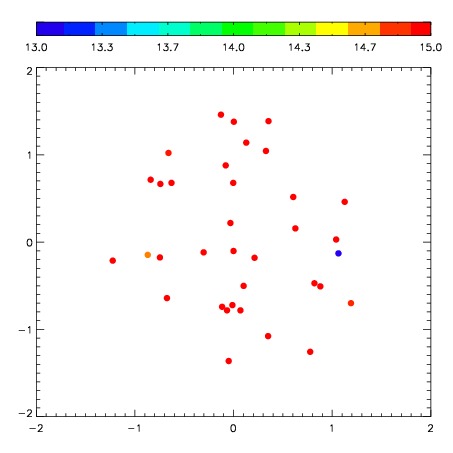
| Frame | Nreads | Zeropoints | Mag plots
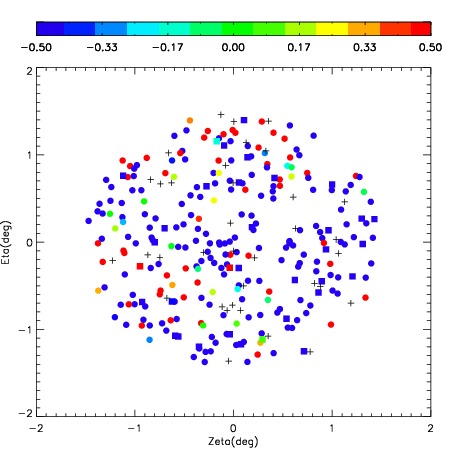
| Spatial mag deviation
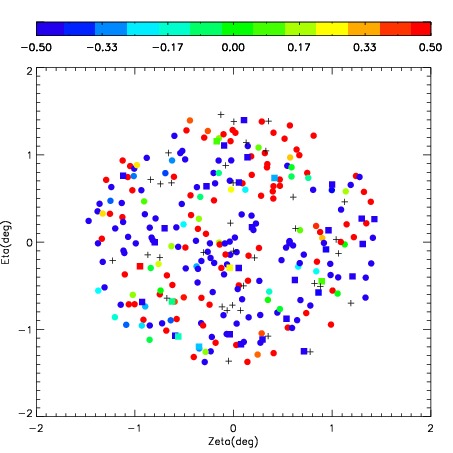
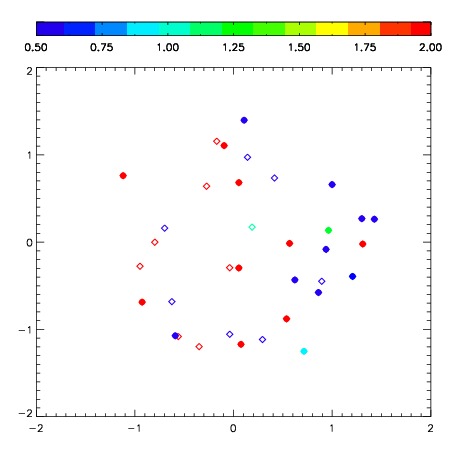
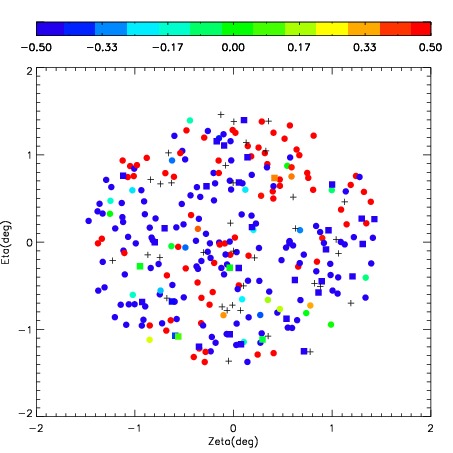
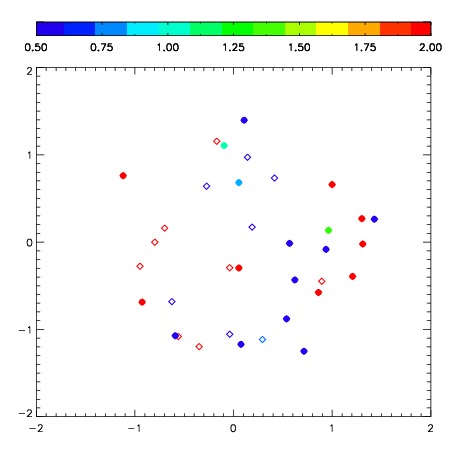
| Spatial sky 16325A emission deviations (filled: sky, open: star)
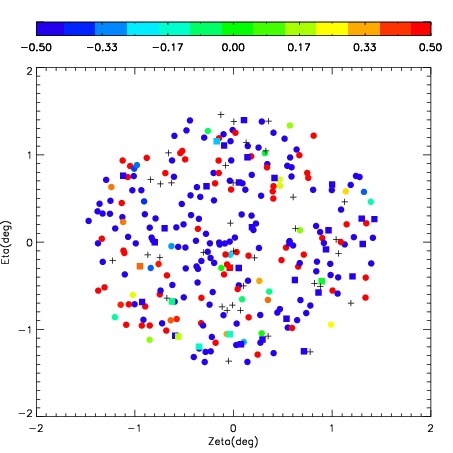
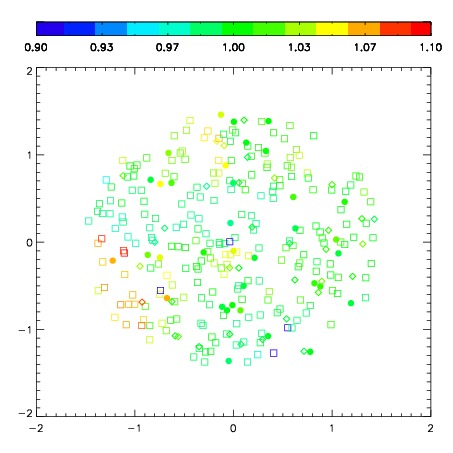
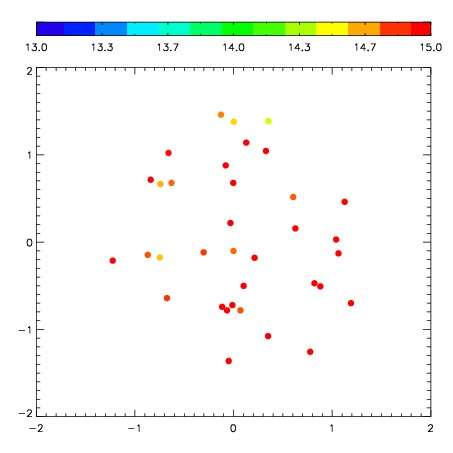
| Spatial sky continuum emission
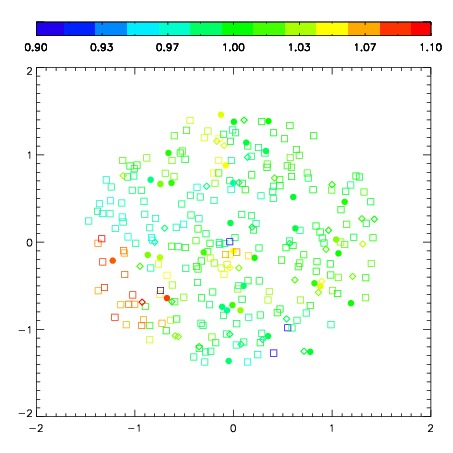
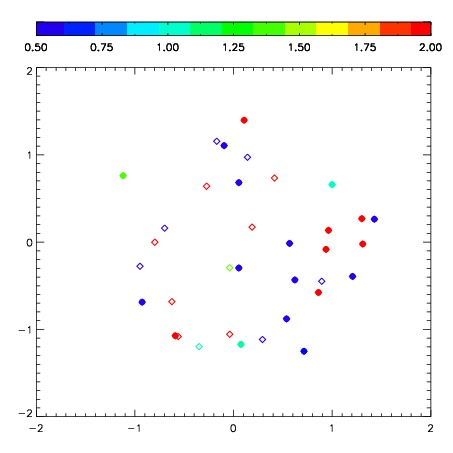
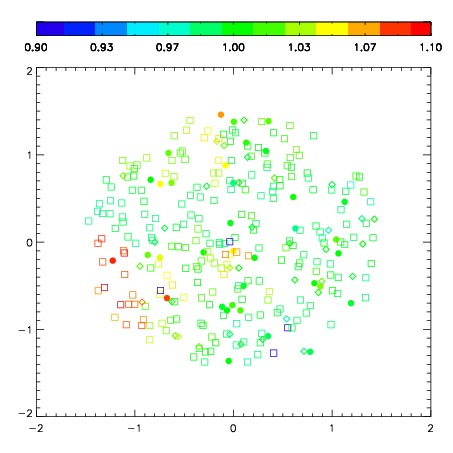
| Spatial sky telluric CO2 absorption deviations (filled: H < 10)
|
| 9980068
| 14
| | Red | Green | Blue
| | z | | 13.75
| | znorm | | 10.88
| | sky | -NaN | 14.7 | 15.0
| | S/N | 0.1 | 0.2 | 2.2
| | S/N(c) | 0.0 | 0.0 | 0.0
| | SN(E/C) 1.41
|
| 
| 
| 
| 
| 
|
| 9980069
| 14
| | Red | Green | Blue
| | z | | 13.08
| | znorm | | 10.22
| | sky | 14.3 | 15.3 | 15.3
| | S/N | 0.0 | 0.0 | 2.3
| | S/N(c) | 0.0 | 0.0 | 0.0
| | SN(E/C) 0.93
|
| 
| 
| 
| 
| 
|
| 9980070
| 14
| | Red | Green | Blue
| | z | | 12.89
| | znorm | | 10.03
| | sky | 15.3 | 14.8 | 15.1
| | S/N | 0.0 | 0.1 | 2.0
| | S/N(c) | 0.0 | 0.0 | 0.0
| | SN(E/C) 1.79
|
| 
| 
| 
| 
| 
|
| 9980071
| 14
| | Red | Green | Blue
| | z | | 12.70
| | znorm | | 9.84
| | sky | 14.1 | 14.9 | 14.5
| | S/N | -0.0 | 0.0 | 1.8
| | S/N(c) | 0.0 | 0.0 | 0.0
| | SN(E/C) 1.28
|
| 
| 
| 
| 
| 
|