| Frame | Nreads | Zeropoints | Mag plots
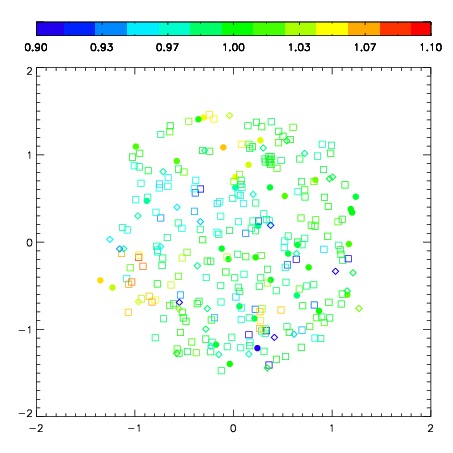
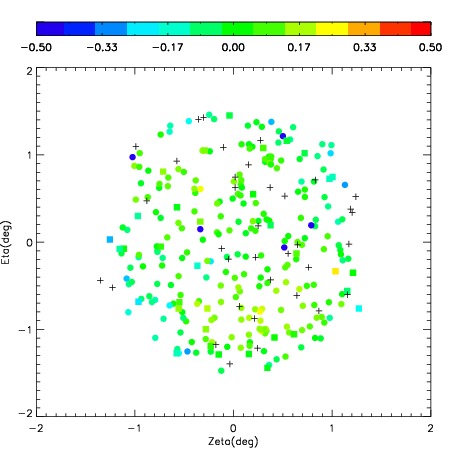
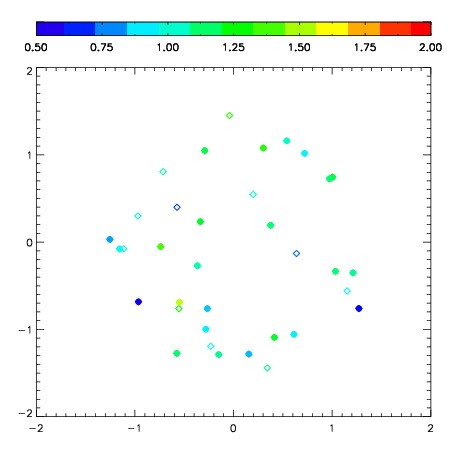
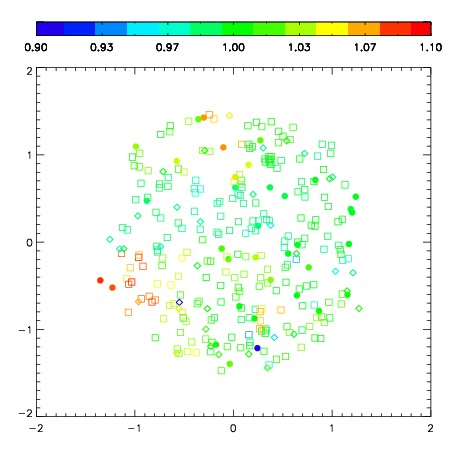
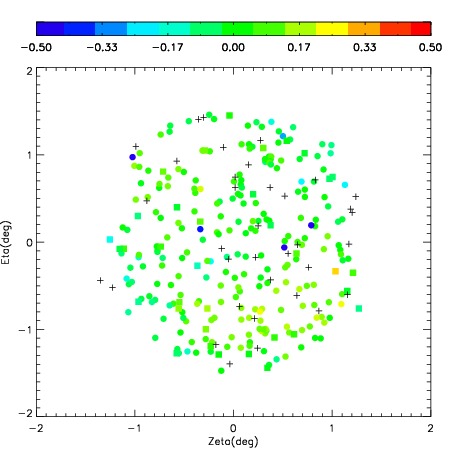
| Spatial mag deviation
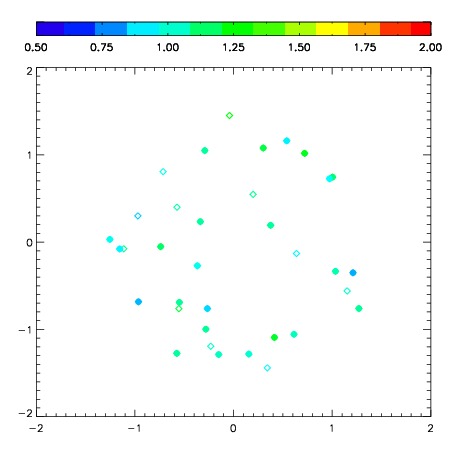
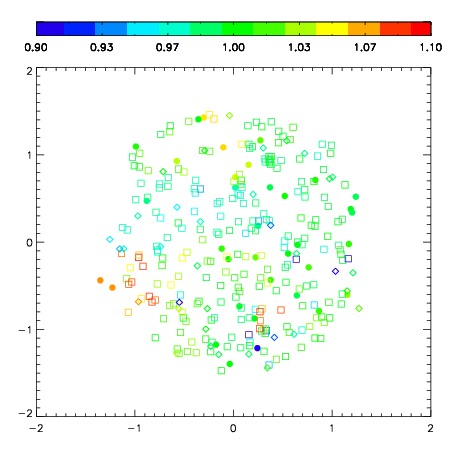
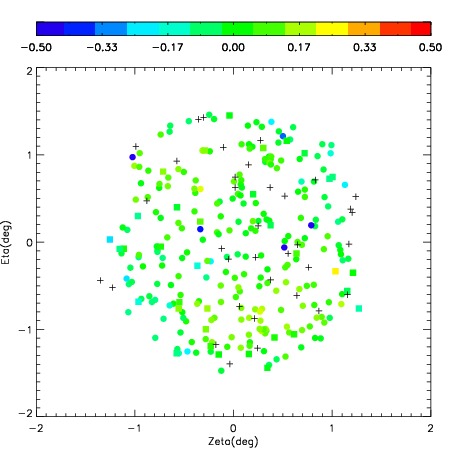
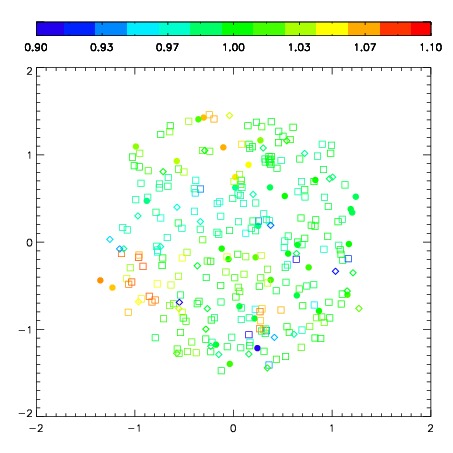
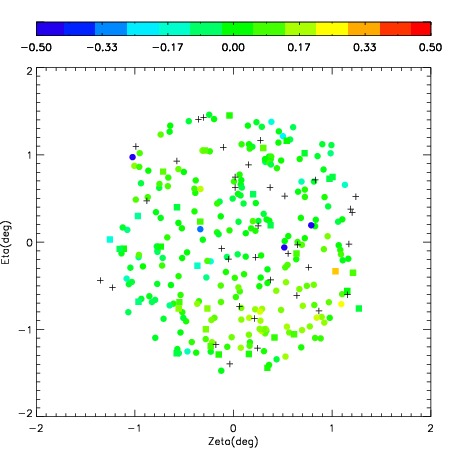
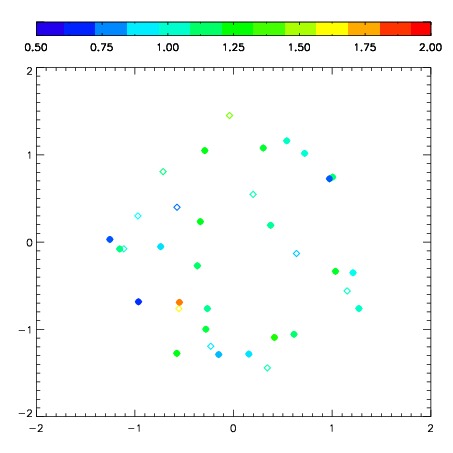
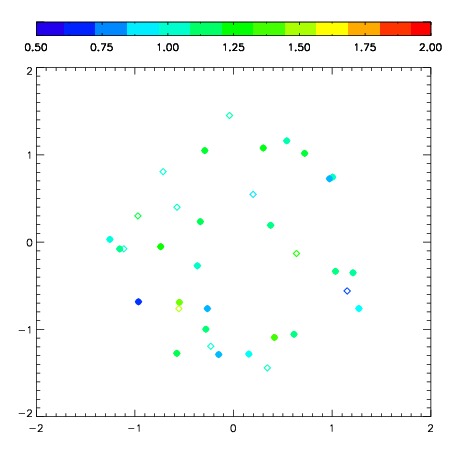
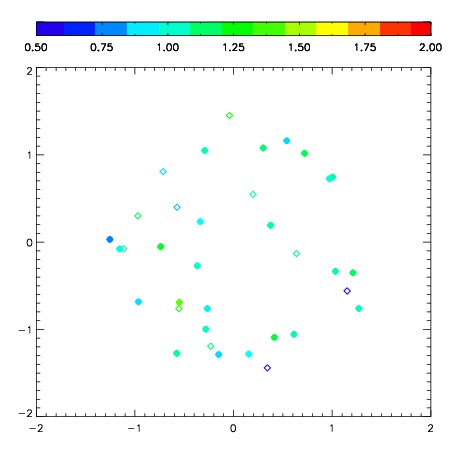
| Spatial sky 16325A emission deviations (filled: sky, open: star)
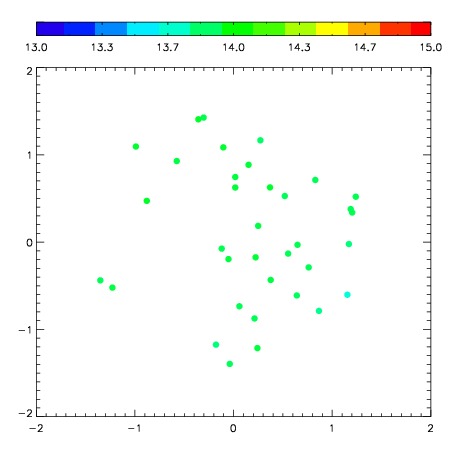
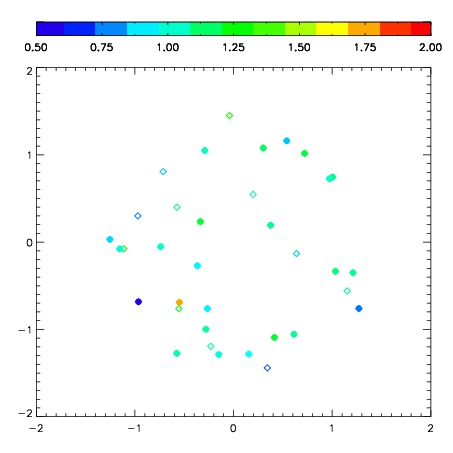
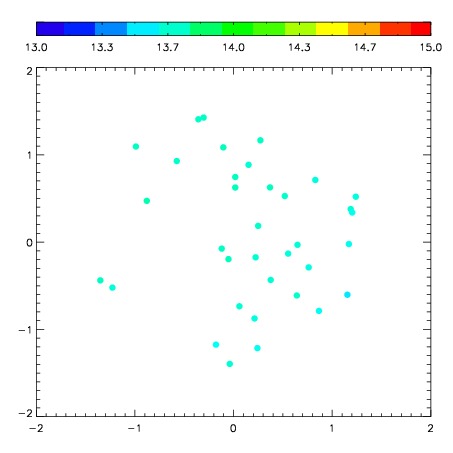
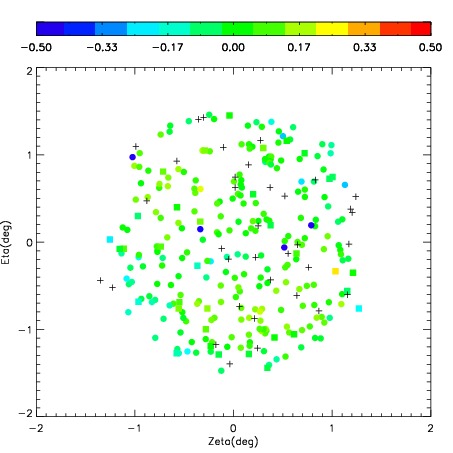
| Spatial sky continuum emission
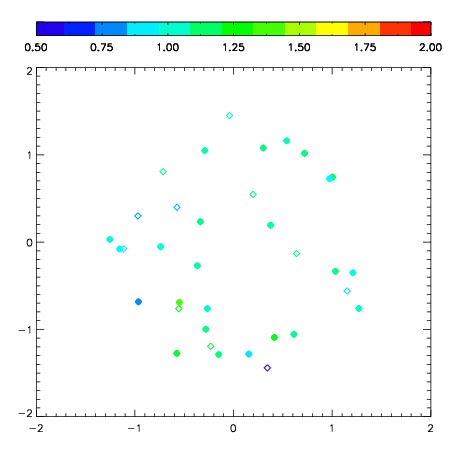
| Spatial sky telluric CO2 absorption deviations (filled: H < 10)
|
| 7290026
| 47
| | Red | Green | Blue
| | z | | 18.33
| | znorm | | 14.15
| | sky | 14.1 | 13.9 | 13.9
| | S/N | 9.0 | 15.5 | 16.9
| | S/N(c) | 8.0 | 14.5 | 15.8
| | SN(E/C) 0.97
|
| 
| 
| 
| 
| 
|
| 7290027
| 47
| | Red | Green | Blue
| | z | | 17.91
| | znorm | | 13.73
| | sky | 13.9 | 13.8 | 13.9
| | S/N | 6.5 | 11.6 | 13.0
| | S/N(c) | 5.7 | 10.6 | 12.4
| | SN(E/C) 1.00
|
| 
| 
| 
| 
| 
|
| 7290028
| 47
| | Red | Green | Blue
| | z | | 17.71
| | znorm | | 13.53
| | sky | 14.0 | 13.8 | 14.1
| | S/N | 5.5 | 10.2 | 11.4
| | S/N(c) | 4.7 | 9.3 | 10.4
| | SN(E/C) 0.99
|
| 
| 
| 
| 
| 
|
| 7290029
| 47
| | Red | Green | Blue
| | z | | 17.49
| | znorm | | 13.31
| | sky | 13.9 | 13.8 | 14.0
| | S/N | 4.5 | 8.5 | 9.8
| | S/N(c) | 4.0 | 7.8 | 8.9
| | SN(E/C) 1.03
|
| 
| 
| 
| 
| 
|
| 7290030
| 47
| | Red | Green | Blue
| | z | | 17.31
| | znorm | | 13.13
| | sky | 13.9 | 13.7 | 13.8
| | S/N | 3.9 | 7.3 | 8.1
| | S/N(c) | 3.5 | 6.6 | 7.6
| | SN(E/C) 1.00
|
| 
| 
| 
| 
| 
|
| 7290031
| 47
| | Red | Green | Blue
| | z | | 17.08
| | znorm | | 12.90
| | sky | 13.6 | 13.6 | 13.7
| | S/N | 3.1 | 6.0 | 6.7
| | S/N(c) | 2.8 | 5.4 | 6.1
| | SN(E/C) 0.98
|
| 
| 
| 
| 
| 
|
| 7290032
| 47
| | Red | Green | Blue
| | z | | 17.15
| | znorm | | 12.97
| | sky | 13.5 | 13.5 | 13.6
| | S/N | 3.2 | 6.3 | 7.1
| | S/N(c) | 2.9 | 5.6 | 6.6
| | SN(E/C) 1.03
|
| 
| 
| 
| 
| 
|
| 7290033
| 47
| | Red | Green | Blue
| | z | | 17.57
| | znorm | | 13.39
| | sky | 13.6 | 13.6 | 13.7
| | S/N | 4.6 | 8.8 | 9.9
| | S/N(c) | 4.0 | 7.9 | 9.1
| | SN(E/C) 0.99
|
| 
| 
| 
| 
| 
|

