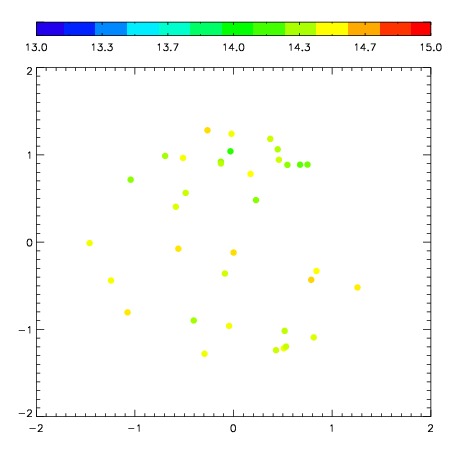
| Frame | Nreads | Zeropoints | Mag plots
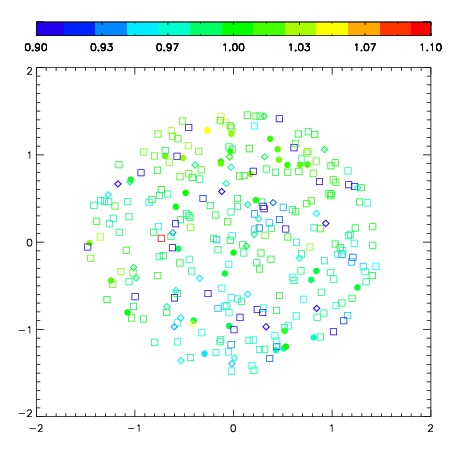
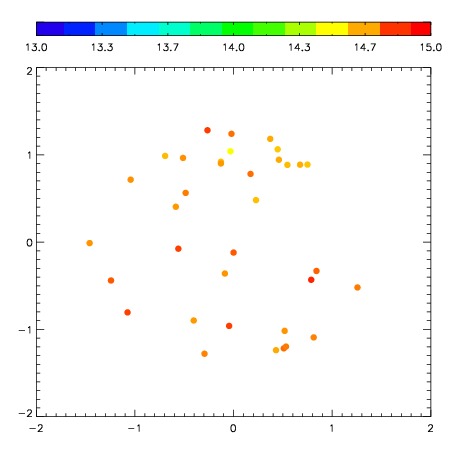
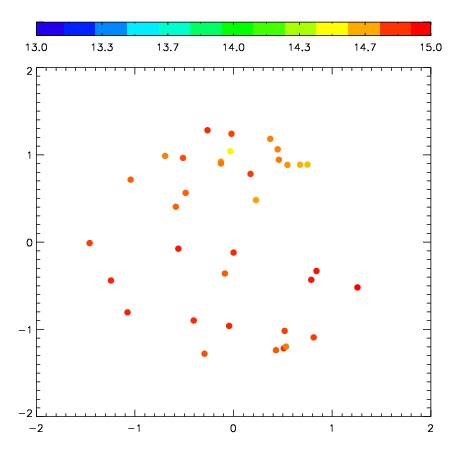
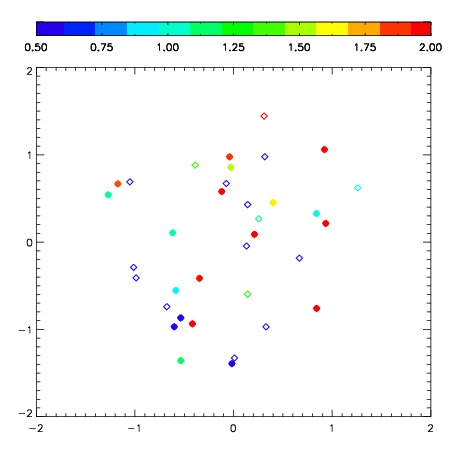
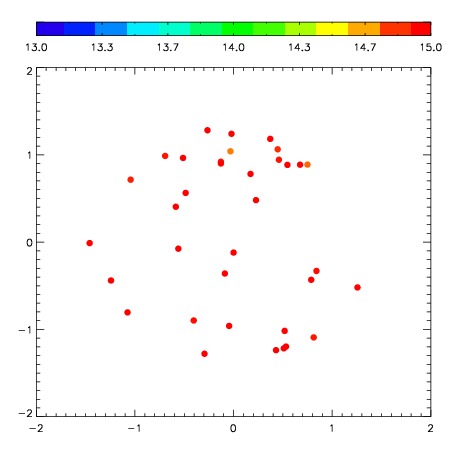
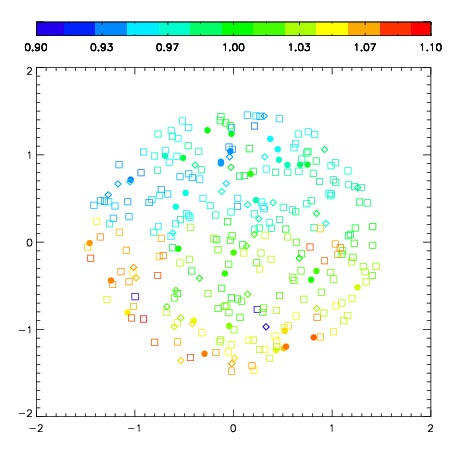
| Spatial mag deviation
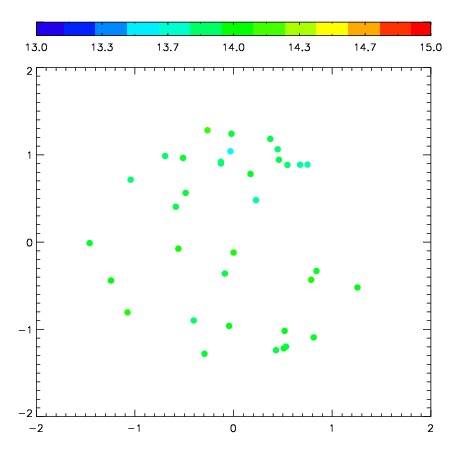
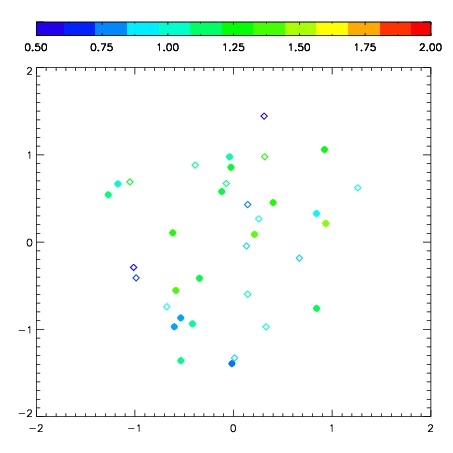
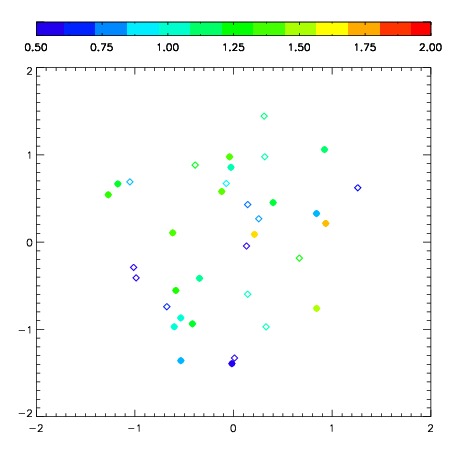
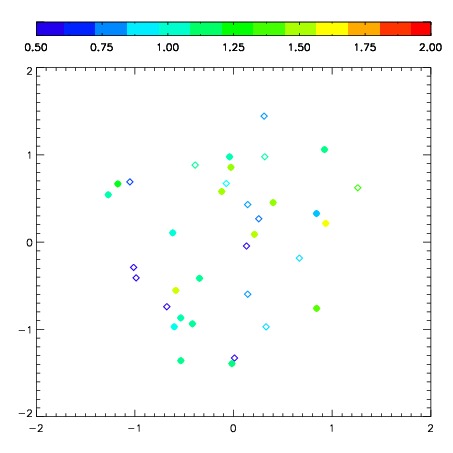
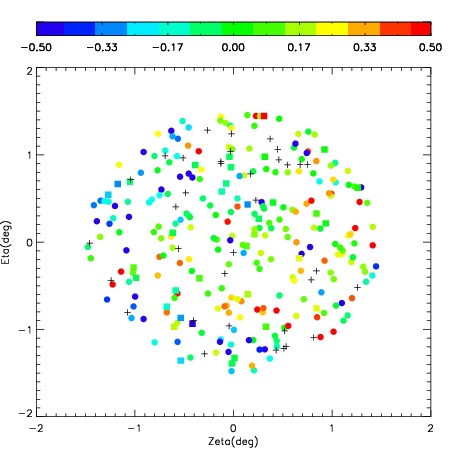
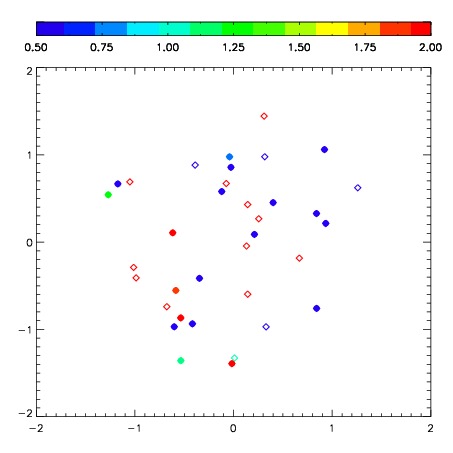
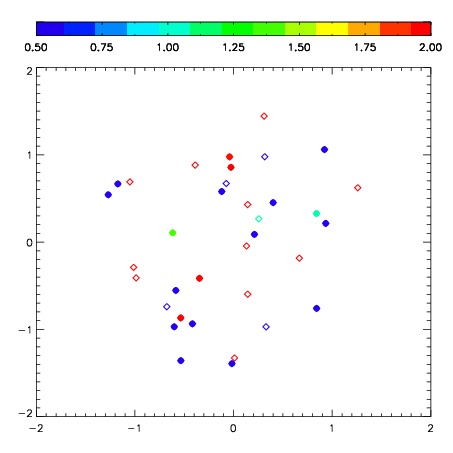
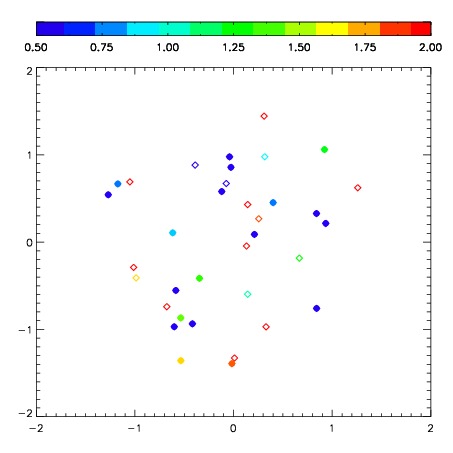
| Spatial sky 16325A emission deviations (filled: sky, open: star)
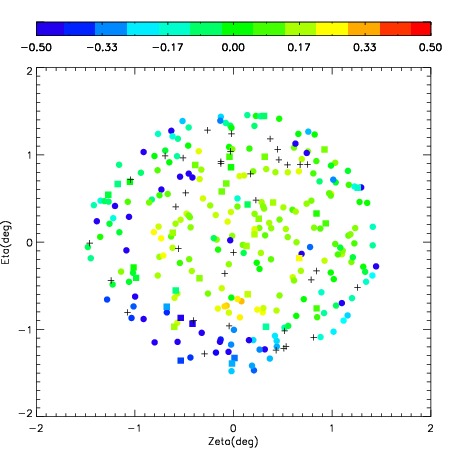
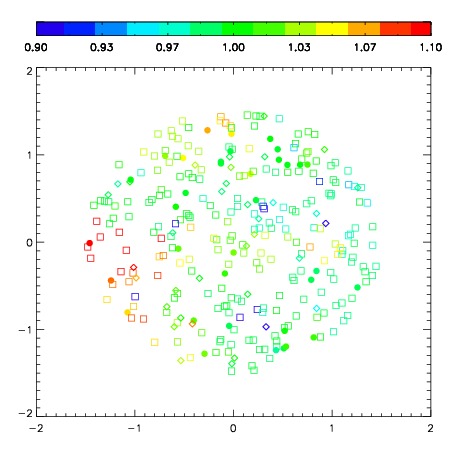
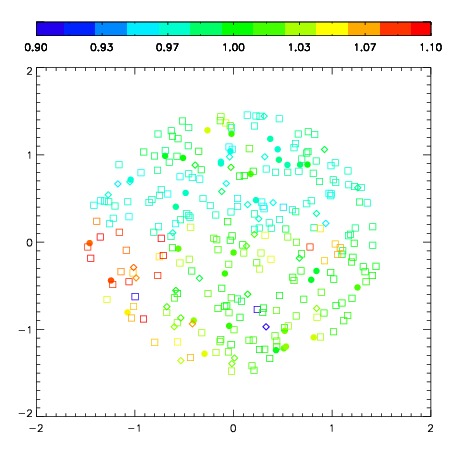
| Spatial sky continuum emission
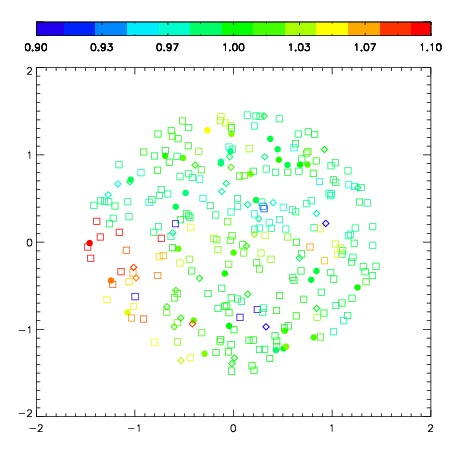
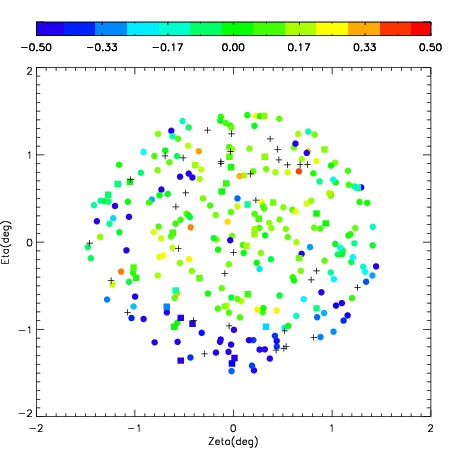
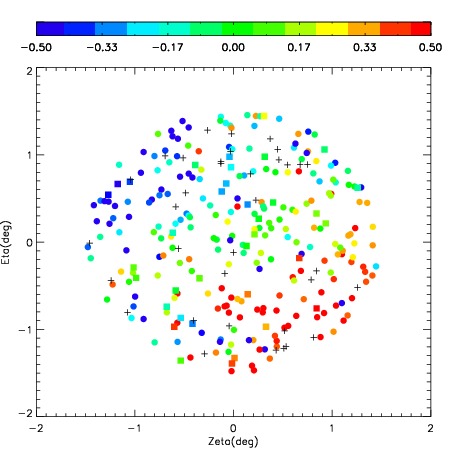
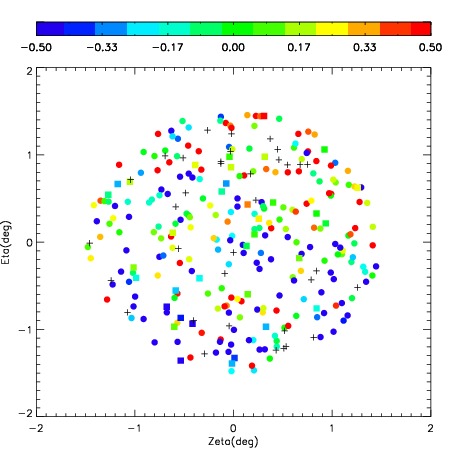
| Spatial sky telluric CO2 absorption deviations (filled: H < 10)
|
| 8780010
| 47
| | Red | Green | Blue
| | z | | 18.43
| | znorm | | 14.25
| | sky | 14.0 | 13.9 | 13.8
| | S/N | 8.9 | 14.9 | 15.4
| | S/N(c) | 8.1 | 13.7 | 14.6
| | SN(E/C) 0.50
|
| 
| 
| 
| 
| 
|
| 8780011
| 47
| | Red | Green | Blue
| | z | | 17.82
| | znorm | | 13.64
| | sky | 14.5 | 14.3 | 14.6
| | S/N | 4.4 | 9.3 | 10.3
| | S/N(c) | 3.9 | 8.5 | 9.7
| | SN(E/C) 0.61
|
| 
| 
| 
| 
| 
|
| 8780012
| 47
| | Red | Green | Blue
| | z | | 16.60
| | znorm | | 12.42
| | sky | 14.5 | 14.6 | 15.1
| | S/N | 1.9 | 4.1 | 5.5
| | S/N(c) | 1.8 | 3.8 | 5.0
| | SN(E/C) 0.87
|
| 
| 
| 
| 
| 
|
| 8780013
| 47
| | Red | Green | Blue
| | z | | 16.98
| | znorm | | 12.80
| | sky | 14.5 | 14.7 | 15.1
| | S/N | 2.6 | 5.5 | 6.5
| | S/N(c) | 2.4 | 5.0 | 6.2
| | SN(E/C) 0.80
|
| 
| 
| 
| 
| 
|
| 8780014
| 47
| | Red | Green | Blue
| | z | | 15.45
| | znorm | | 11.27
| | sky | 14.9 | 14.9 | 15.4
| | S/N | 0.7 | 1.9 | 2.4
| | S/N(c) | 0.6 | 1.5 | 2.1
| | SN(E/C) 1.00
|
| 
| 
| 
| 
| 
|
| 8780015
| 47
| | Red | Green | Blue
| | z | | 14.20
| | znorm | | 10.02
| | sky | 15.1 | 14.9 | 15.6
| | S/N | 0.4 | 0.6 | 1.7
| | S/N(c) | 0.3 | 0.6 | 1.5
| | SN(E/C) 1.04
|
| 
| 
| 
| 
| 
|
| 8780016
| 47
| | Red | Green | Blue
| | z | | 14.20
| | znorm | | 10.02
| | sky | 14.8 | 15.0 | 15.6
| | S/N | 0.3 | 0.6 | 2.0
| | S/N(c) | 0.3 | 0.5 | 1.8
| | SN(E/C) 0.98
|
| 
| 
| 
| 
| 
|
| 8780017
| 47
| | Red | Green | Blue
| | z | | 13.11
| | znorm | | 8.93
| | sky | 14.6 | 15.0 | 15.8
| | S/N | 0.0 | 0.2 | 1.2
| | S/N(c) | 0.0 | 0.0 | 0.0
| | SN(E/C) 2.22
|
| 
| 
| 
| 
| 
|