| Red | Green | Blue | |
| z | 17.66 | ||
| znorm | Inf | ||
| sky | -Inf | -Inf | -Inf |
| S/N | 23.7 | 43.5 | 46.2 |
| S/N(c) | 0.0 | 0.0 | 0.0 |
| SN(E/C) |
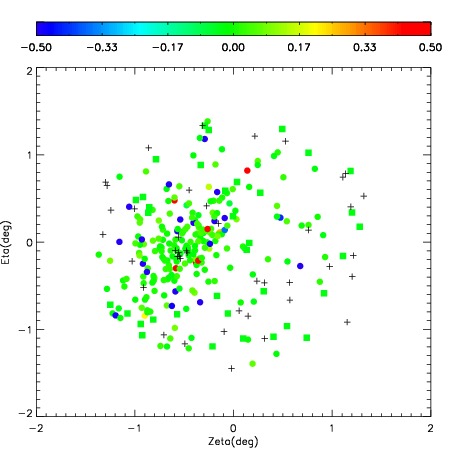
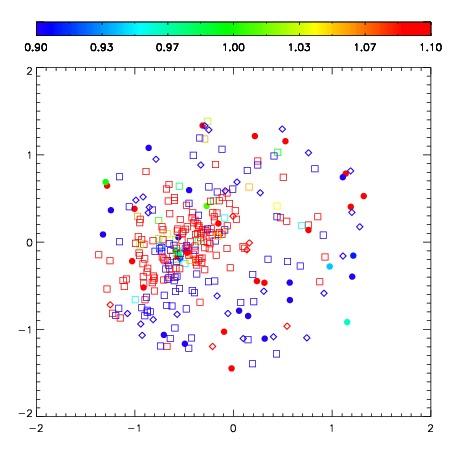
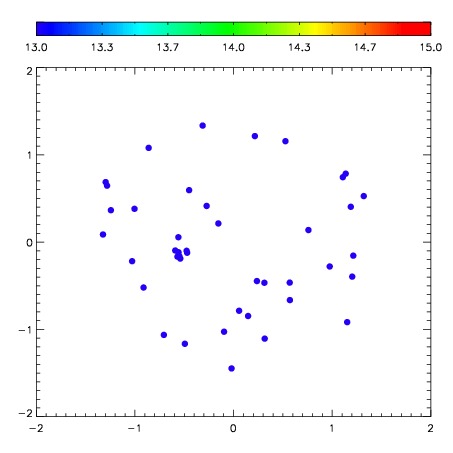
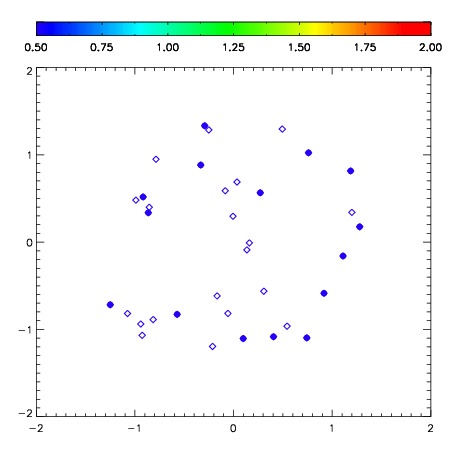
| Frame | Nreads | Zeropoints | Mag plots | Spatial mag deviation | Spatial sky 16325A emission deviations (filled: sky, open: star) | Spatial sky continuum emission | Spatial sky telluric CO2 absorption deviations (filled: H < 10) | |||||||||||||||||||||||
| 0 | 0 |
|
|
|
|
|
|
| IPAIR | NAME | SHIFT | NEWSHIFT | S/N | NAME | SHIFT | NEWSHIFT | S/N |
| 0 | 10490062 | 0.548158 | 0.00000 | 209.167 | 10490061 | 0.00000 | 0.548158 | 204.786 |
| 1 | 10490067 | 0.540816 | 0.00734198 | 222.502 | 10490064 | 0.0625054 | 0.485653 | 212.910 |
| 2 | 10490063 | 0.535952 | 0.0122060 | 218.596 | 10490068 | 0.0580554 | 0.490103 | 209.554 |
| 3 | 10490066 | 0.537264 | 0.0108940 | 210.459 | 10490065 | 0.0538364 | 0.494322 | 207.459 |