| Frame | Nreads | Zeropoints | Mag plots
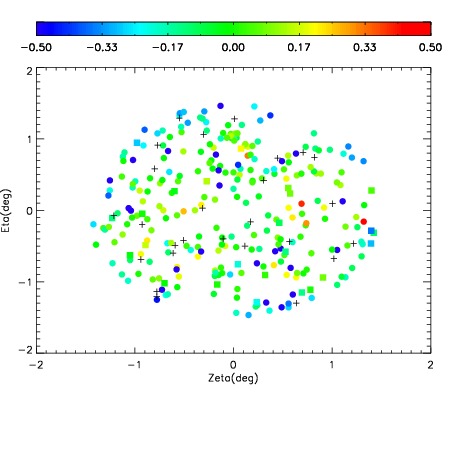
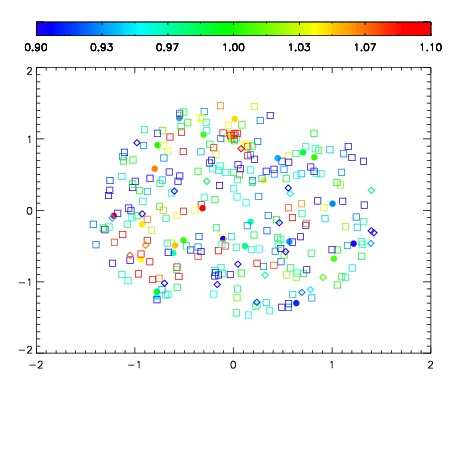
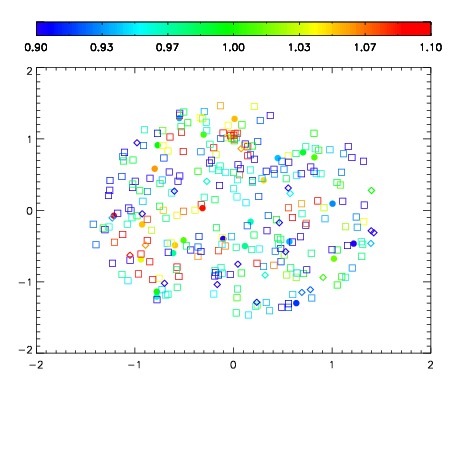
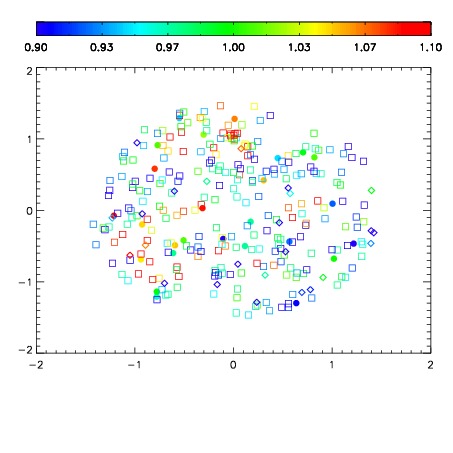
| Spatial mag deviation
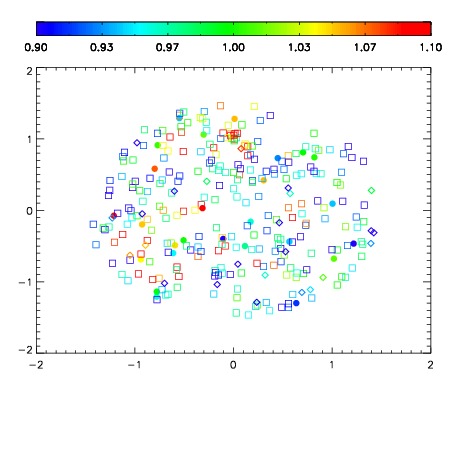
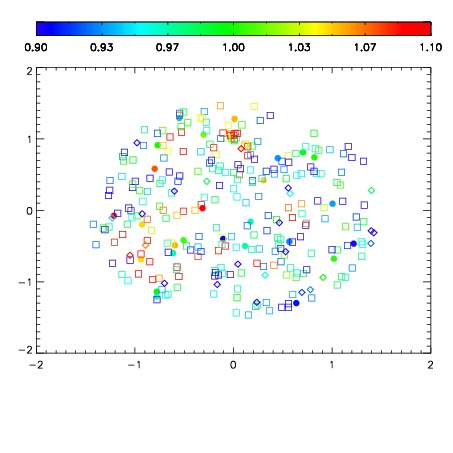
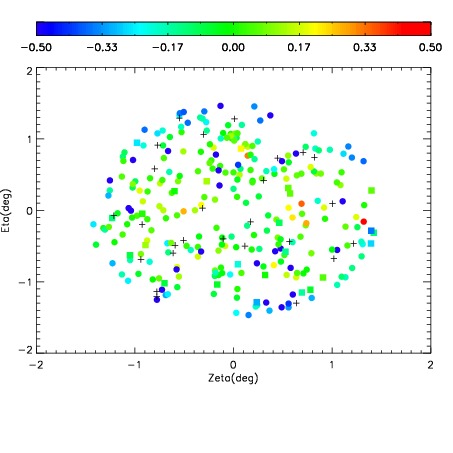
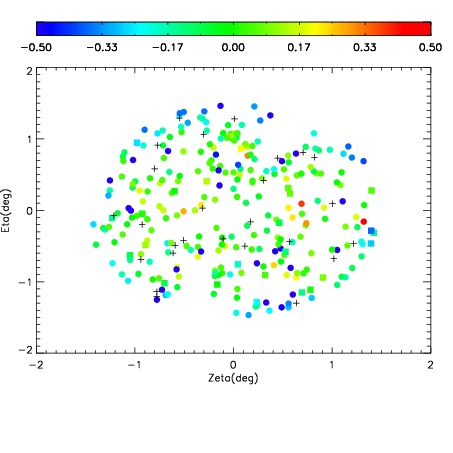
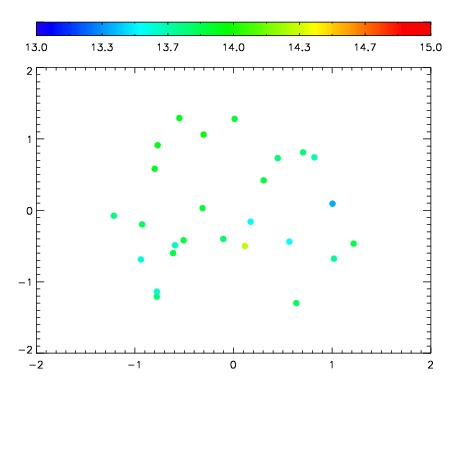
| Spatial sky 16325A emission deviations (filled: sky, open: star)
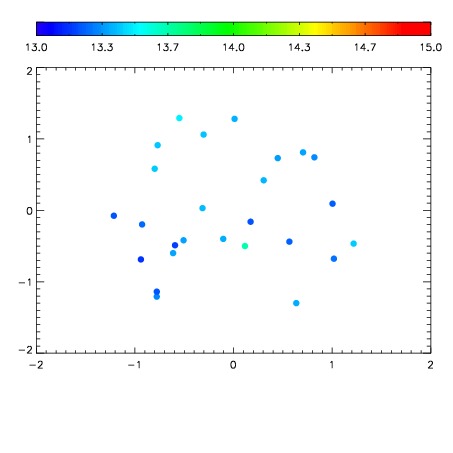
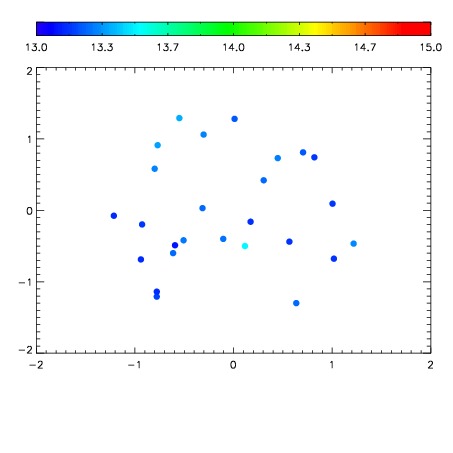
| Spatial sky continuum emission
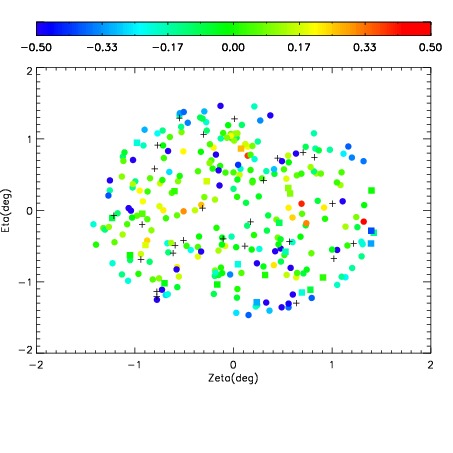
| Spatial sky telluric CO2 absorption deviations (filled: H < 10)
|
| 1640021
| 50
| | Red | Green | Blue
| | z | | 18.59
| | znorm | | 14.34
| | sky | 13.4 | 13.2 | 13.1
| | S/N | 10.5 | 16.3 | 17.2
| | S/N(c) | 9.3 | 15.4 | 18.3
| | SN(E/C) 0.39
|
| 
| 
| 
| 
| 
|
| 1640022
| 50
| | Red | Green | Blue
| | z | | 18.63
| | znorm | | 14.39
| | sky | 13.5 | 13.4 | 13.4
| | S/N | 10.5 | 17.1 | 18.3
| | S/N(c) | 9.4 | 15.7 | 18.6
| | SN(E/C) 0.40
|
| 
| 
| 
| 
| 
|
| 1640023
| 50
| | Red | Green | Blue
| | z | | 18.42
| | znorm | | 14.17
| | sky | 13.4 | 13.2 | 13.2
| | S/N | 9.0 | 13.9 | 16.0
| | S/N(c) | 8.0 | 13.3 | 16.6
| | SN(E/C) 0.41
|
| 
| 
| 
| 
| 
|
| 1640024
| 50
| | Red | Green | Blue
| | z | | 19.10
| | znorm | | 14.85
| | sky | 13.9 | 13.8 | 13.6
| | S/N | 14.8 | 22.9 | 25.9
| | S/N(c) | 13.3 | 21.4 | 26.1
| | SN(E/C) 0.31
|
| 
| 
| 
| 
| 
|
| 1640025
| 50
| | Red | Green | Blue
| | z | | 19.03
| | znorm | | 14.78
| | sky | 14.1 | 13.8 | 13.7
| | S/N | 14.3 | 22.0 | 24.3
| | S/N(c) | 12.5 | 20.4 | 24.2
| | SN(E/C) 0.32
|
| 
| 
| 
| 
| 
|