| Red | Green | Blue | |
| z | 17.64 | ||
| znorm | Inf | ||
| sky | -NaN | -NaN | -Inf |
| S/N | 35.1 | 58.1 | 66.1 |
| S/N(c) | 0.0 | 0.0 | 0.0 |
| SN(E/C) |
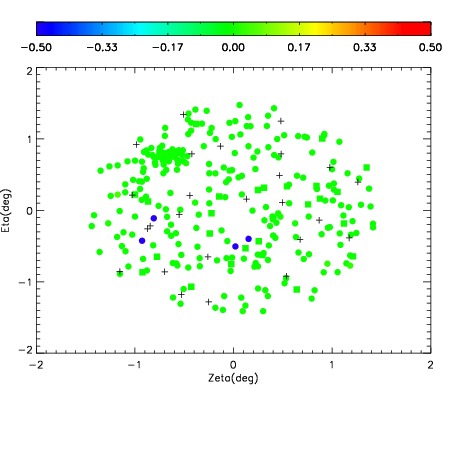
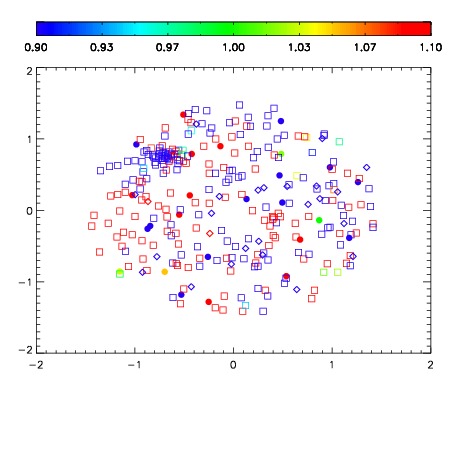
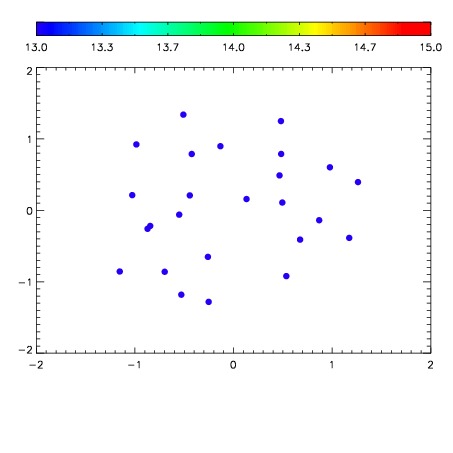

| Frame | Nreads | Zeropoints | Mag plots | Spatial mag deviation | Spatial sky 16325A emission deviations (filled: sky, open: star) | Spatial sky continuum emission | Spatial sky telluric CO2 absorption deviations (filled: H < 10) | |||||||||||||||||||||||
| 0 | 0 |
|
|
|
|
|
|
| 01410011 | 0.00000 | 227.977 |
| 01410012 | 0.00000 | 229.591 |
| 01410013 | 0.00000 | 231.938 |
| 01410014 | 0.00000 | 230.241 |
| 01410015 | 0.00000 | 232.226 |
| 01410016 | 0.00000 | 222.192 |