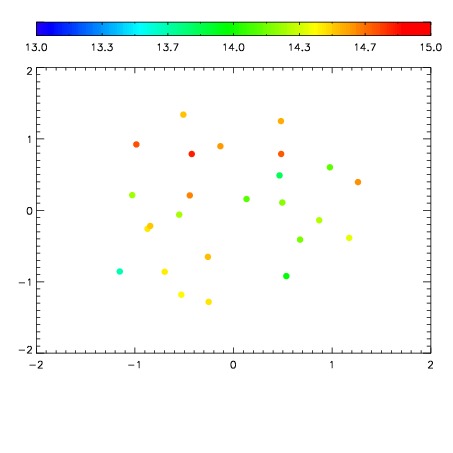
| Frame | Nreads | Zeropoints | Mag plots
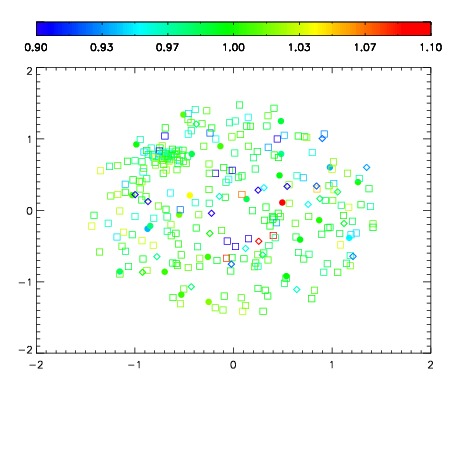
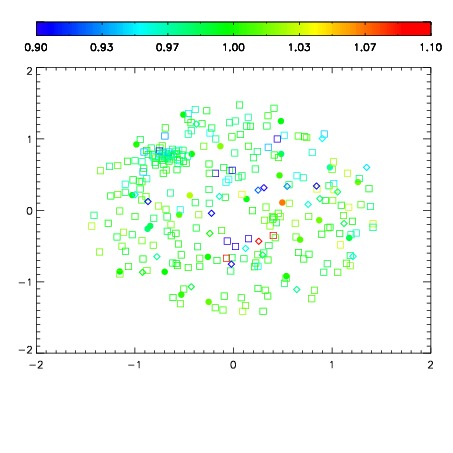
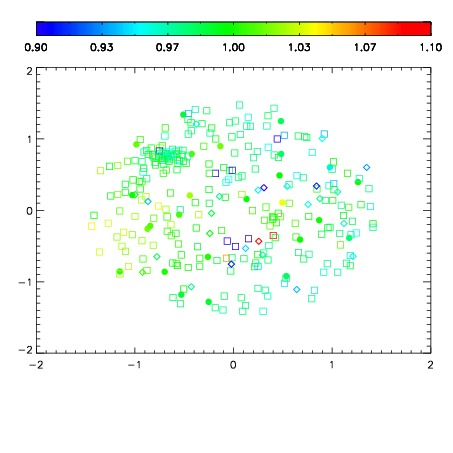
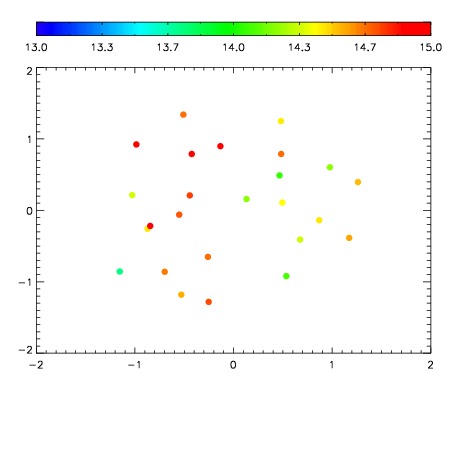
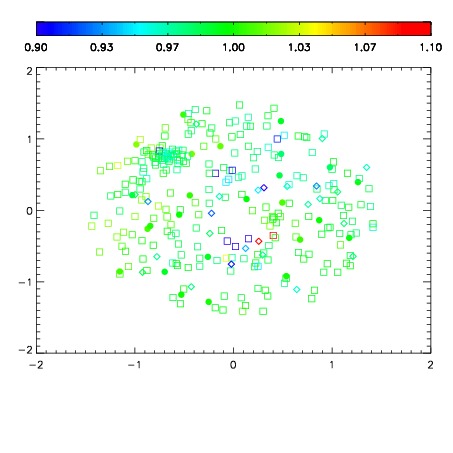
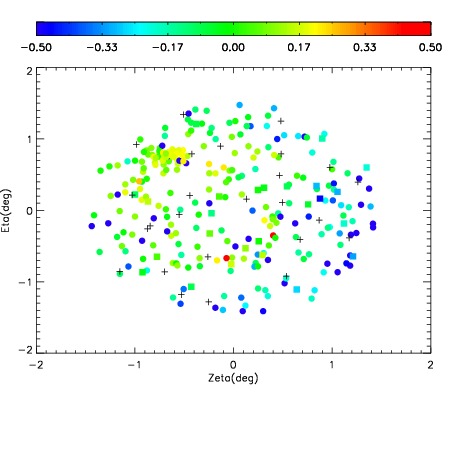
| Spatial mag deviation
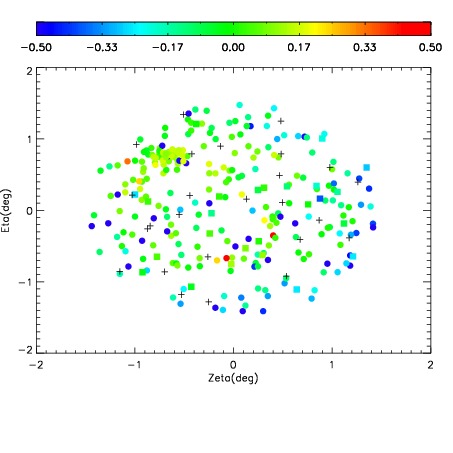
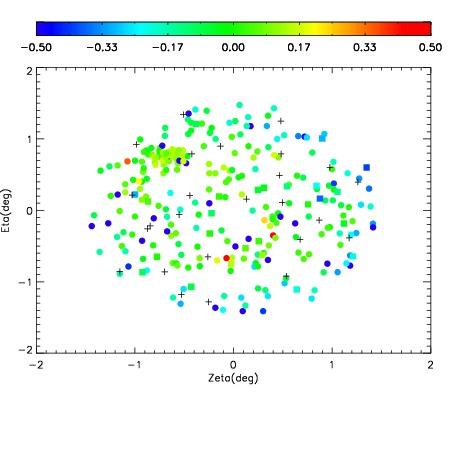
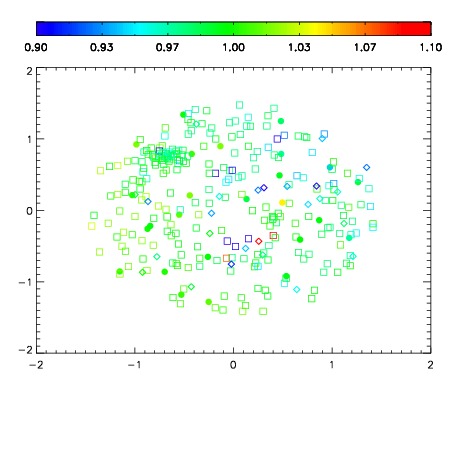
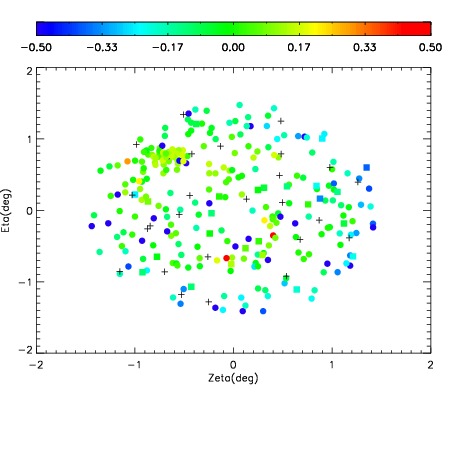
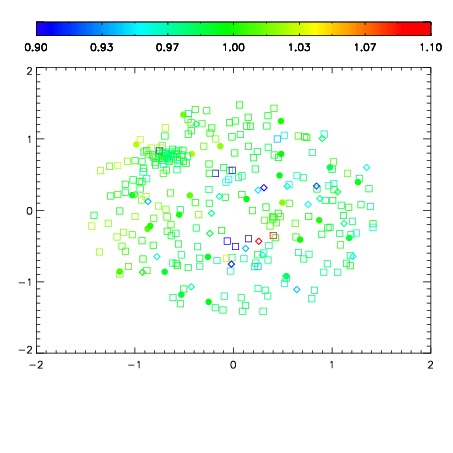
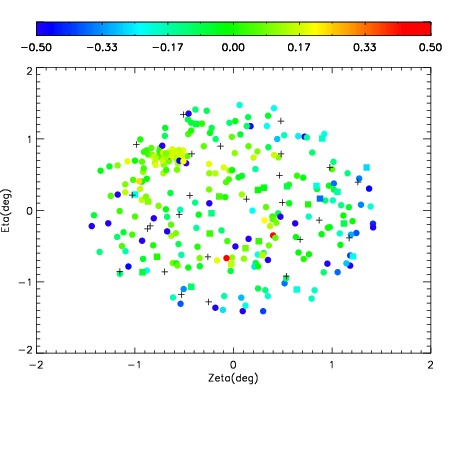
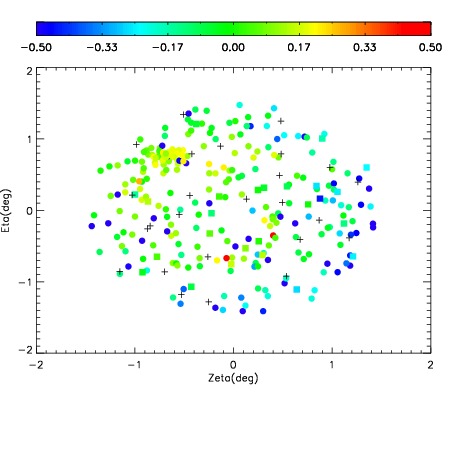
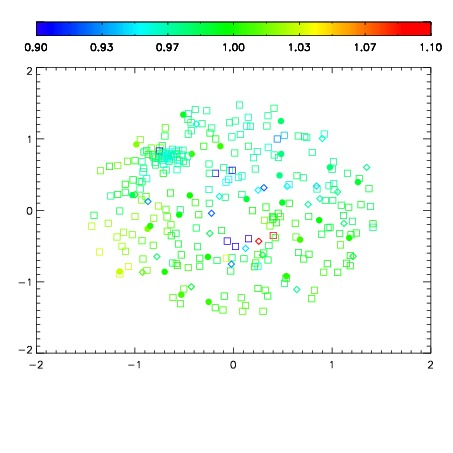
| Spatial sky 16325A emission deviations (filled: sky, open: star)
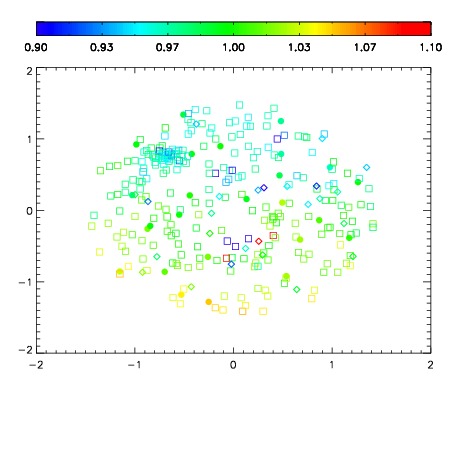
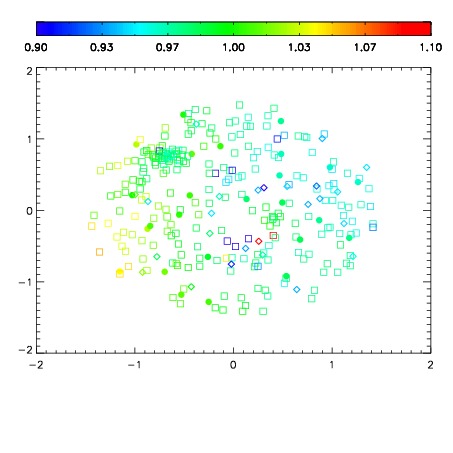
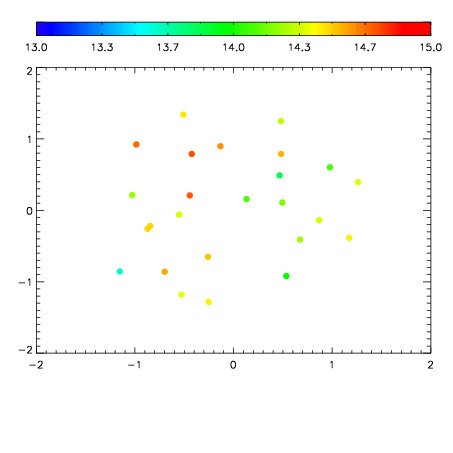
| Spatial sky continuum emission
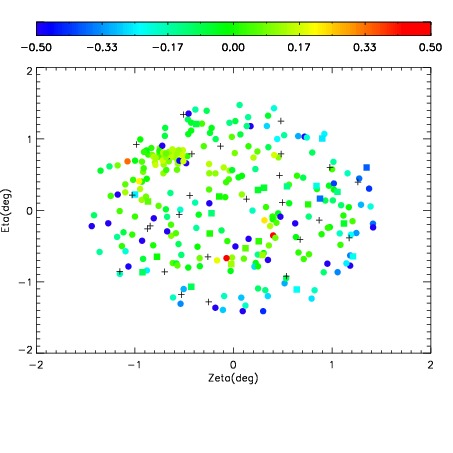
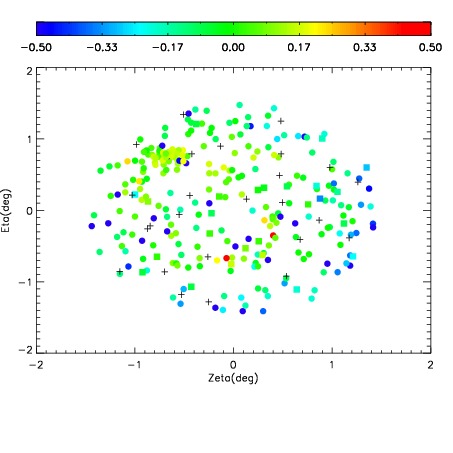
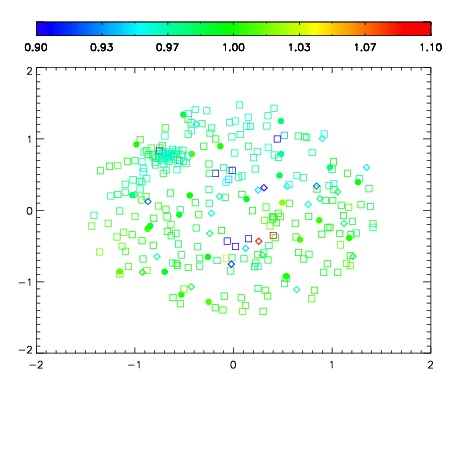
| Spatial sky telluric CO2 absorption deviations (filled: H < 10)
|
| 1420008
| 50
| | Red | Green | Blue
| | z | | 19.04
| | znorm | | 14.79
| | sky | 14.6 | 14.5 | 13.9
| | S/N | 15.3 | 24.4 | 25.4
| | S/N(c) | 13.6 | 22.8 | 24.7
| | SN(E/C) 0.28
|
| 
| 
| 
| 
| 
|
| 1420009
| 50
| | Red | Green | Blue
| | z | | 19.10
| | znorm | | 14.86
| | sky | 14.5 | 14.5 | 14.2
| | S/N | 15.8 | 24.9 | 26.5
| | S/N(c) | 14.0 | 22.8 | 26.4
| | SN(E/C) 0.29
|
| 
| 
| 
| 
| 
|
| 1420010
| 50
| | Red | Green | Blue
| | z | | 19.10
| | znorm | | 14.85
| | sky | 14.5 | 14.5 | 14.2
| | S/N | 15.6 | 24.6 | 26.6
| | S/N(c) | 13.7 | 22.7 | 26.1
| | SN(E/C) 0.29
|
| 
| 
| 
| 
| 
|
| 1420011
| 50
| | Red | Green | Blue
| | z | | 19.00
| | znorm | | 14.75
| | sky | 14.4 | 14.5 | 14.4
| | S/N | 14.6 | 23.4 | 25.2
| | S/N(c) | 13.0 | 21.6 | 24.6
| | SN(E/C) 0.30
|
| 
| 
| 
| 
| 
|
| 1420012
| 50
| | Red | Green | Blue
| | z | | 19.02
| | znorm | | 14.77
| | sky | 14.5 | 14.5 | 14.3
| | S/N | 14.8 | 23.3 | 25.0
| | S/N(c) | 13.2 | 21.5 | 24.7
| | SN(E/C) 0.30
|
| 
| 
| 
| 
| 
|
| 1420013
| 50
| | Red | Green | Blue
| | z | | 18.95
| | znorm | | 14.70
| | sky | 14.5 | 14.6 | 14.2
| | S/N | 14.4 | 22.8 | 24.2
| | S/N(c) | 12.7 | 21.1 | 23.8
| | SN(E/C) 0.30
|
| 
| 
| 
| 
| 
|
| 1420014
| 50
| | Red | Green | Blue
| | z | | 18.98
| | znorm | | 14.73
| | sky | 14.5 | 14.5 | 14.3
| | S/N | 14.5 | 23.1 | 24.9
| | S/N(c) | 12.7 | 21.3 | 24.0
| | SN(E/C) 0.31
|
| 
| 
| 
| 
| 
|
| 1420015
| 50
| | Red | Green | Blue
| | z | | 18.99
| | znorm | | 14.74
| | sky | 14.5 | 14.4 | 14.3
| | S/N | 14.8 | 23.1 | 24.5
| | S/N(c) | 12.9 | 21.3 | 23.7
| | SN(E/C) 0.32
|
| 
| 
| 
| 
| 
|
| 1420016
| 50
| | Red | Green | Blue
| | z | | 19.01
| | znorm | | 14.76
| | sky | 14.6 | 14.7 | 14.4
| | S/N | 14.9 | 23.6 | 25.4
| | S/N(c) | 13.1 | 21.7 | 24.3
| | SN(E/C) 0.30
|
| 
| 
| 
| 
| 
|
| 1420017
| 50
| | Red | Green | Blue
| | z | | 18.99
| | znorm | | 14.74
| | sky | 14.5 | 14.4 | 14.2
| | S/N | 14.2 | 23.1 | 24.2
| | S/N(c) | 12.5 | 21.0 | 23.6
| | SN(E/C) 0.30
|
| 
| 
| 
| 
| 
|