| Red | Green | Blue | |
| z | 17.63 | ||
| znorm | Inf | ||
| sky | -NaN | -NaN | -Inf |
| S/N | 41.8 | 69.6 | 78.2 |
| S/N(c) | 0.0 | 0.0 | 0.0 |
| SN(E/C) |
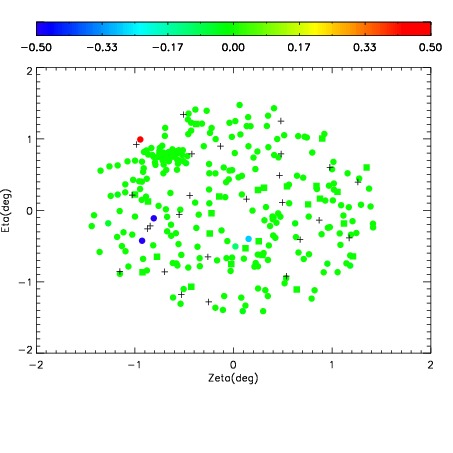
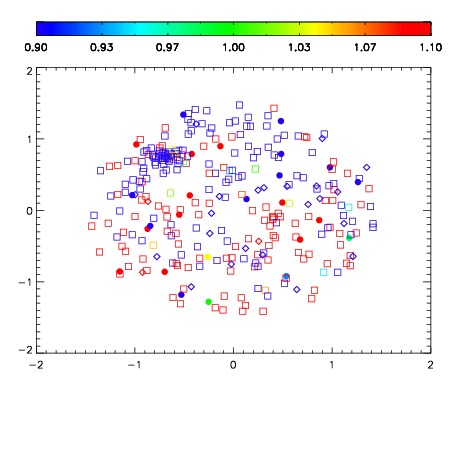
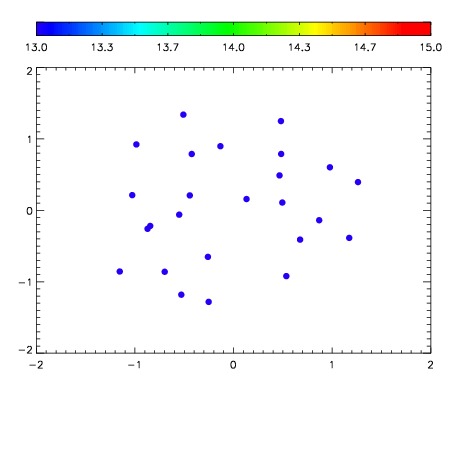

| Frame | Nreads | Zeropoints | Mag plots | Spatial mag deviation | Spatial sky 16325A emission deviations (filled: sky, open: star) | Spatial sky continuum emission | Spatial sky telluric CO2 absorption deviations (filled: H < 10) | |||||||||||||||||||||||
| 0 | 0 |
|
|
|
|
|
|
| 01420008 | 0.00000 | 216.973 |
| 01420009 | 0.00000 | 217.603 |
| 01420010 | 0.00000 | 214.787 |
| 01420011 | 0.00000 | 204.952 |
| 01420012 | 0.00000 | 205.981 |
| 01420013 | 0.00000 | 201.689 |
| 01420014 | 0.00000 | 204.199 |
| 01420015 | 0.00000 | 203.941 |
| 01420016 | 0.00000 | 206.783 |
| 01420017 | 0.00000 | 205.883 |