| Red | Green | Blue | |
| z | 17.64 | ||
| znorm | Inf | ||
| sky | -Inf | -Inf | -Inf |
| S/N | 34.6 | 54.8 | 66.6 |
| S/N(c) | 0.0 | 0.0 | 0.0 |
| SN(E/C) |
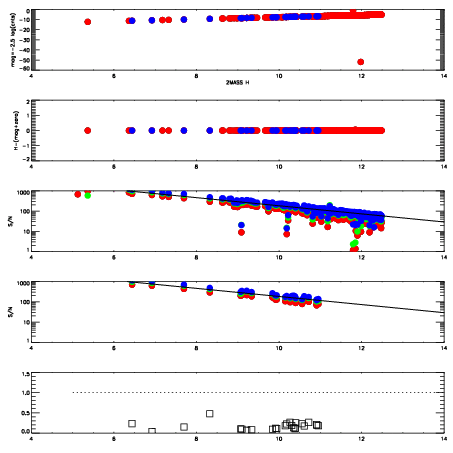
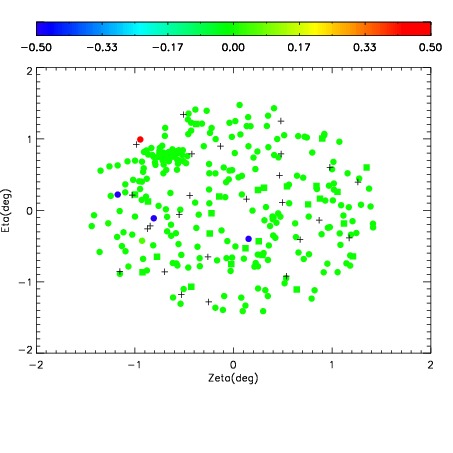
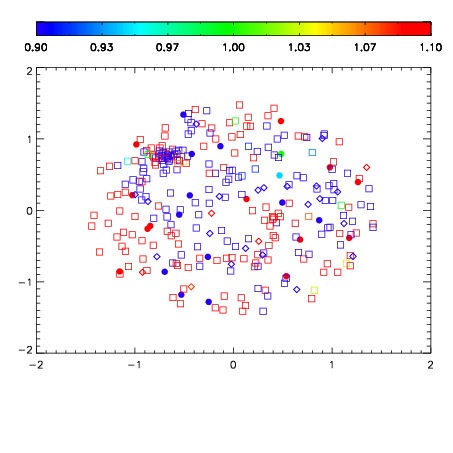
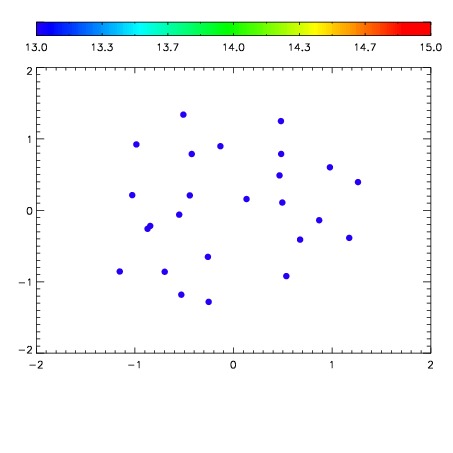

| Frame | Nreads | Zeropoints | Mag plots | Spatial mag deviation | Spatial sky 16325A emission deviations (filled: sky, open: star) | Spatial sky continuum emission | Spatial sky telluric CO2 absorption deviations (filled: H < 10) | |||||||||||||||||||||||
| 0 | 0 |
|
|
|
|
|
|
| 01970009 | 0.00000 | 219.771 |
| 01970010 | 0.00000 | 219.692 |
| 01970011 | 0.00000 | 217.533 |
| 01970012 | 0.00000 | 182.102 |
| 01970013 | 0.00000 | 173.247 |
| 01970014 | 0.00000 | 194.984 |
| 01970015 | 0.00000 | 208.649 |
| 01970016 | 0.00000 | 210.140 |
| 01970017 | 0.00000 | 210.519 |