| Red | Green | Blue | |
| z | 17.64 | ||
| znorm | Inf | ||
| sky | -NaN | -NaN | -Inf |
| S/N | 44.9 | 71.0 | 85.0 |
| S/N(c) | 0.0 | 0.0 | 0.0 |
| SN(E/C) |
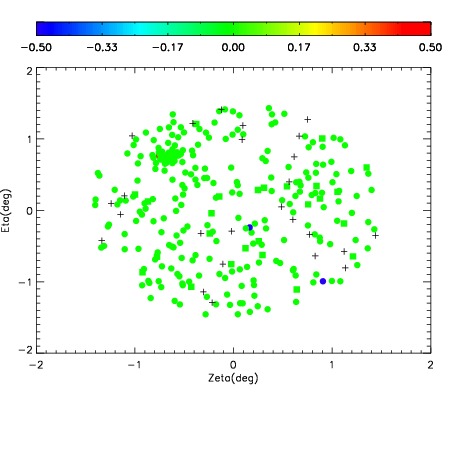
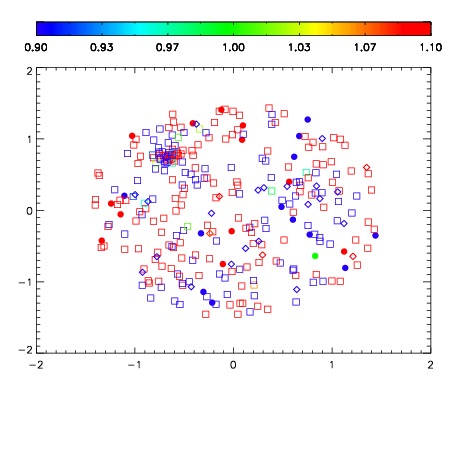
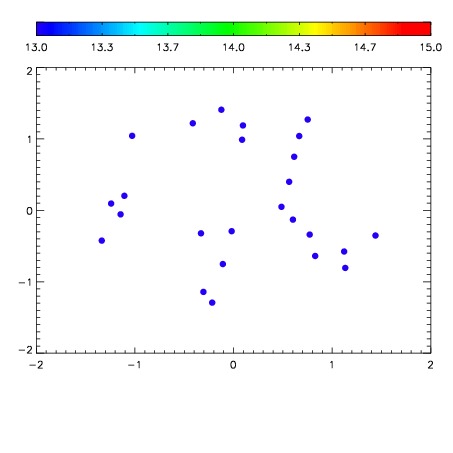

| Frame | Nreads | Zeropoints | Mag plots | Spatial mag deviation | Spatial sky 16325A emission deviations (filled: sky, open: star) | Spatial sky continuum emission | Spatial sky telluric CO2 absorption deviations (filled: H < 10) | |||||||||||||||||||||||
| 0 | 0 |
|
|
|
|
|
|
| 01610018 | 0.00000 | 227.116 |
| 01610019 | 0.00000 | 233.448 |
| 01610020 | 0.00000 | 234.571 |
| 01610021 | 0.00000 | 232.847 |
| 01610022 | 0.00000 | 227.902 |
| 01610023 | 0.00000 | 226.006 |
| 01610024 | 0.00000 | 230.282 |
| 01610025 | 0.00000 | 229.139 |
| 01610026 | 0.00000 | 227.390 |
| 01610027 | 0.00000 | 231.084 |