| Red | Green | Blue | |
| z | 17.64 | ||
| znorm | Inf | ||
| sky | -NaN | -NaN | -Inf |
| S/N | 28.9 | 46.9 | 54.7 |
| S/N(c) | 0.0 | 0.0 | 0.0 |
| SN(E/C) |
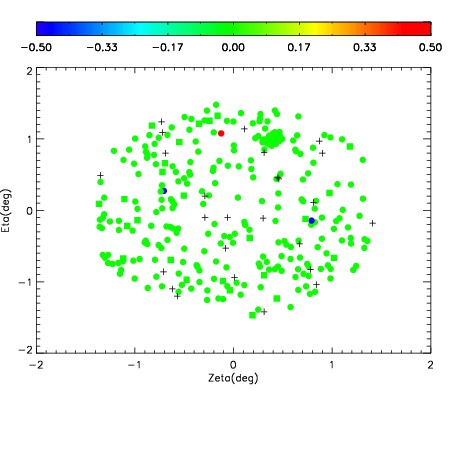
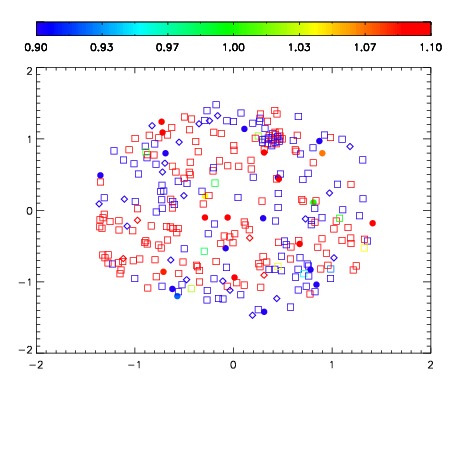
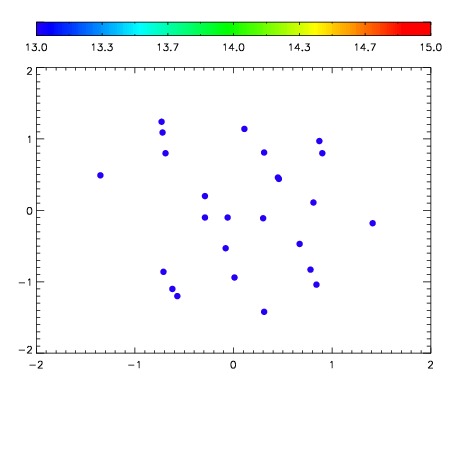

| Frame | Nreads | Zeropoints | Mag plots | Spatial mag deviation | Spatial sky 16325A emission deviations (filled: sky, open: star) | Spatial sky continuum emission | Spatial sky telluric CO2 absorption deviations (filled: H < 10) | |||||||||||||||||||||||
| 0 | 0 |
|
|
|
|
|
|
| 01680024 | 0.00000 | 189.751 |
| 01680025 | 0.00000 | 193.456 |
| 01680026 | 0.00000 | 189.837 |
| 01680027 | 0.00000 | 183.859 |
| 01680028 | 0.00000 | 183.401 |
| 01680029 | 0.00000 | 177.044 |