| Red | Green | Blue | |
| z | 17.64 | ||
| znorm | Inf | ||
| sky | -NaN | -NaN | -Inf |
| S/N | 32.6 | 55.0 | 69.4 |
| S/N(c) | 0.0 | 0.0 | 0.0 |
| SN(E/C) |
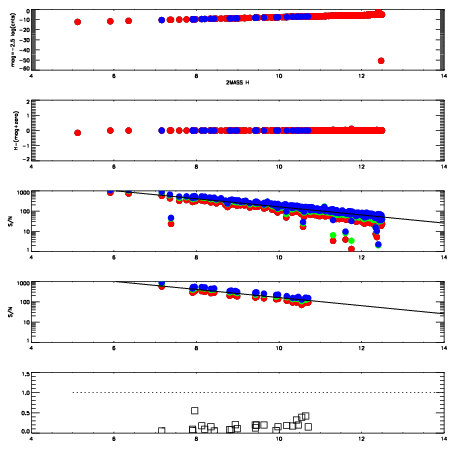
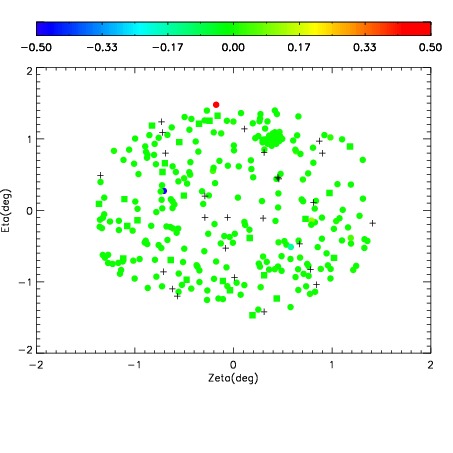
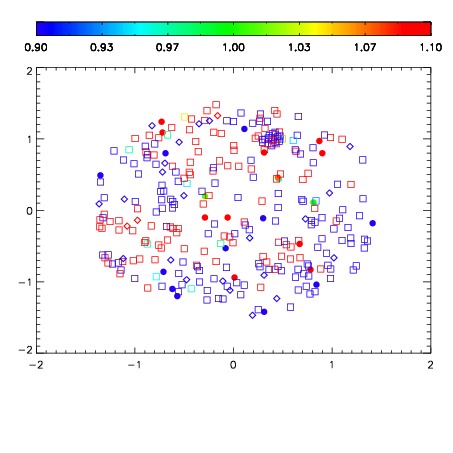
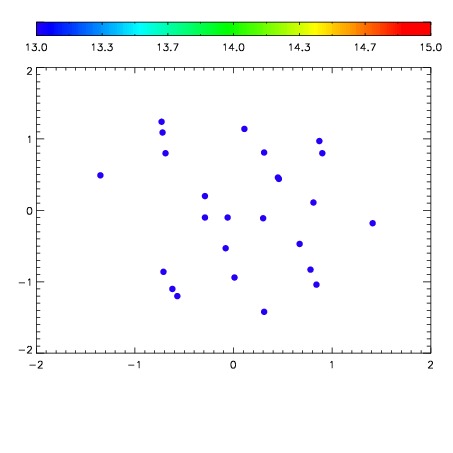

| Frame | Nreads | Zeropoints | Mag plots | Spatial mag deviation | Spatial sky 16325A emission deviations (filled: sky, open: star) | Spatial sky continuum emission | Spatial sky telluric CO2 absorption deviations (filled: H < 10) | |||||||||||||||||||||||
| 0 | 0 |
|
|
|
|
|
|
| 01900061 | 0.00000 | 161.683 |
| 01900062 | 0.00000 | 164.634 |
| 01900063 | 0.00000 | 170.506 |
| 01900064 | 0.00000 | 170.866 |
| 01900065 | 0.00000 | 160.390 |
| 01900066 | 0.00000 | 173.360 |
| 01900067 | 0.00000 | 172.839 |