| Red | Green | Blue | |
| z | 17.64 | ||
| znorm | Inf | ||
| sky | -NaN | -Inf | -Inf |
| S/N | 59.7 | 90.8 | 107.2 |
| S/N(c) | 59.7 | 90.8 | 107.2 |
| SN(E/C) |
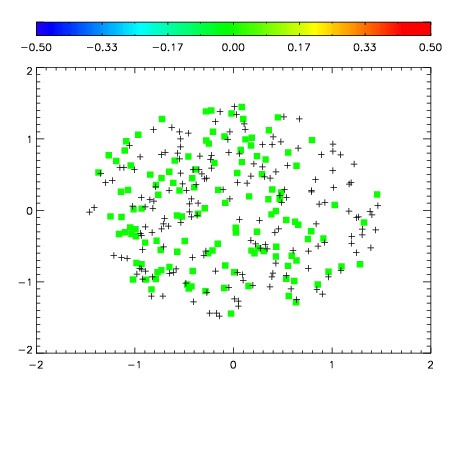
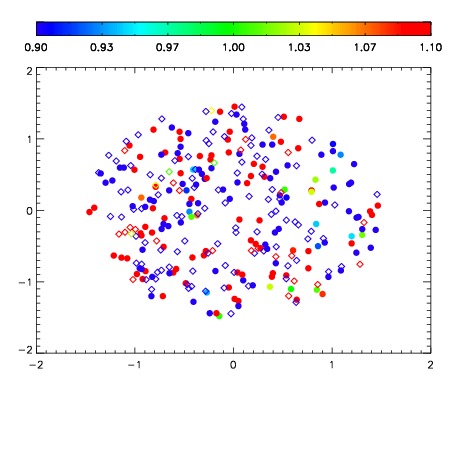
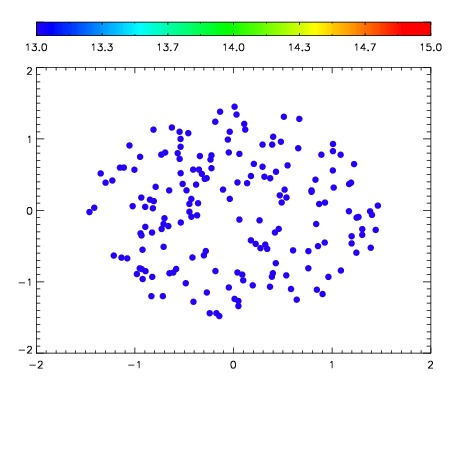

| Frame | Nreads | Zeropoints | Mag plots | Spatial mag deviation | Spatial sky 16325A emission deviations (filled: sky, open: star) | Spatial sky continuum emission | Spatial sky telluric CO2 absorption deviations (filled: H < 10) | |||||||||||||||||||||||
| 0 | 0 |
|
|
|
|
|
|
| 01620034 | 0.00000 | 192.634 |
| 01620035 | 0.00000 | 195.691 |
| 01620036 | 0.00000 | 195.642 |
| 01620037 | 0.00000 | 193.919 |
| 01620038 | 0.00000 | 200.379 |
| 01620039 | 0.00000 | 202.257 |
| 01620040 | 0.00000 | 204.642 |
| 01620041 | 0.00000 | 206.099 |
| 01620042 | 0.00000 | 208.891 |
| 01620043 | 0.00000 | 210.261 |
| 01620044 | 0.00000 | 211.216 |
| 01620045 | 0.00000 | 211.377 |