| Red | Green | Blue | |
| z | 17.64 | ||
| znorm | Inf | ||
| sky | -Inf | -Inf | -Inf |
| S/N | 35.4 | 57.8 | 68.1 |
| S/N(c) | 0.0 | 0.0 | 0.0 |
| SN(E/C) |

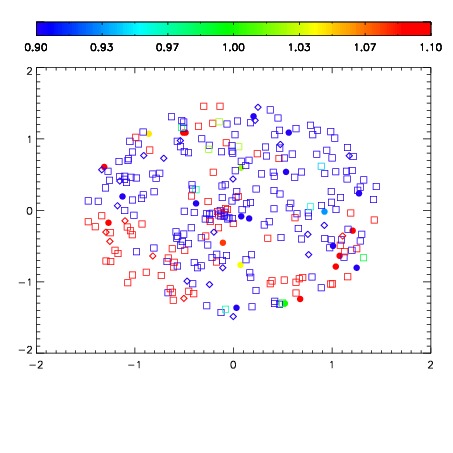
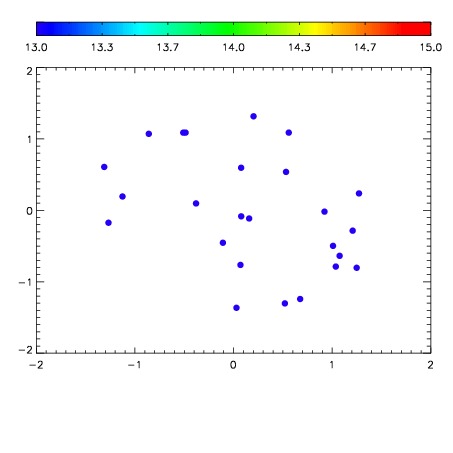

| Frame | Nreads | Zeropoints | Mag plots | Spatial mag deviation | Spatial sky 16325A emission deviations (filled: sky, open: star) | Spatial sky continuum emission | Spatial sky telluric CO2 absorption deviations (filled: H < 10) | |||||||||||||||||||||||
| 0 | 0 |
|
|
|
|
|
|
| 01660029 | 0.00000 | 247.733 |
| 01660030 | 0.00000 | 248.241 |
| 01660031 | 0.00000 | 244.978 |
| 01660032 | 0.00000 | 246.520 |
| 01660033 | 0.00000 | 243.986 |
| 01660034 | 0.00000 | 234.721 |