| Red | Green | Blue | |
| z | 17.64 | ||
| znorm | Inf | ||
| sky | -Inf | -Inf | -Inf |
| S/N | 34.3 | 55.6 | 64.9 |
| S/N(c) | 0.0 | 0.0 | 0.0 |
| SN(E/C) |
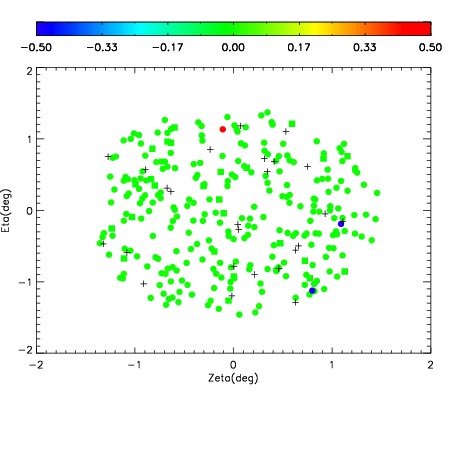
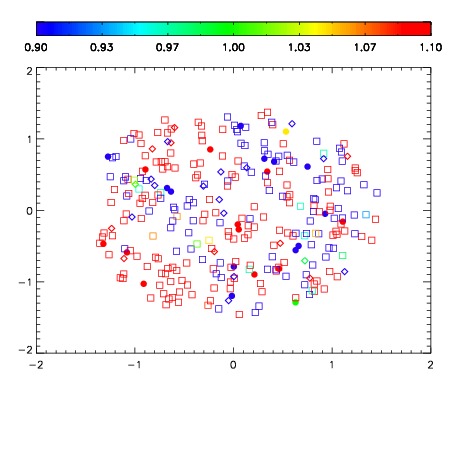
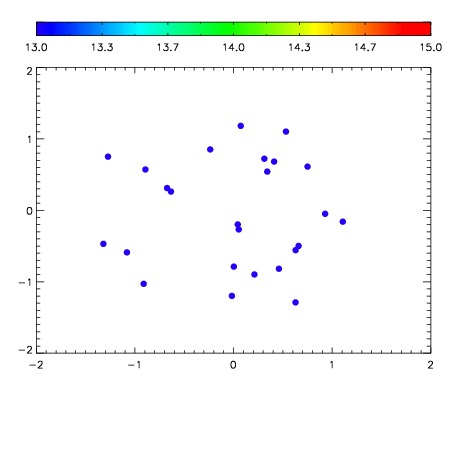

| Frame | Nreads | Zeropoints | Mag plots | Spatial mag deviation | Spatial sky 16325A emission deviations (filled: sky, open: star) | Spatial sky continuum emission | Spatial sky telluric CO2 absorption deviations (filled: H < 10) | |||||||||||||||||||||||
| 0 | 0 |
|
|
|
|
|
|
| 01600085 | 0.00000 | 227.447 |
| 01600086 | 0.00000 | 232.800 |
| 01600087 | 0.00000 | 228.003 |
| 01600088 | 0.00000 | 234.822 |
| 01600089 | 0.00000 | 244.610 |
| 01600090 | 0.00000 | 235.749 |