| Red | Green | Blue | |
| z | 17.64 | ||
| znorm | Inf | ||
| sky | -NaN | -Inf | -Inf |
| S/N | 31.1 | 52.9 | 59.7 |
| S/N(c) | 0.0 | 0.0 | 0.0 |
| SN(E/C) |

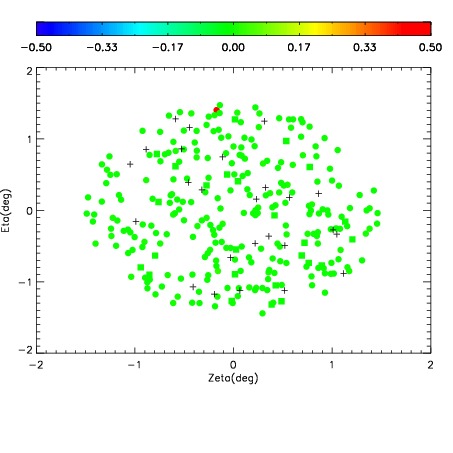


| Frame | Nreads | Zeropoints | Mag plots | Spatial mag deviation | Spatial sky 16325A emission deviations (filled: sky, open: star) | Spatial sky continuum emission | Spatial sky telluric CO2 absorption deviations (filled: H < 10) | |||||||||||||||||||||||
| 0 | 0 |
|
|
|
|
|
|
| 01690022 | 0.00000 | 189.496 |
| 01690023 | 0.00000 | 199.146 |
| 01690024 | 0.00000 | 201.358 |
| 01690025 | 0.00000 | 201.573 |
| 01690026 | 0.00000 | 210.531 |
| 01690027 | 0.00000 | 212.743 |