| Red | Green | Blue | |
| z | 17.64 | ||
| znorm | Inf | ||
| sky | -Inf | -Inf | -Inf |
| S/N | 32.4 | 50.5 | 64.6 |
| S/N(c) | 0.0 | 0.0 | 0.0 |
| SN(E/C) |
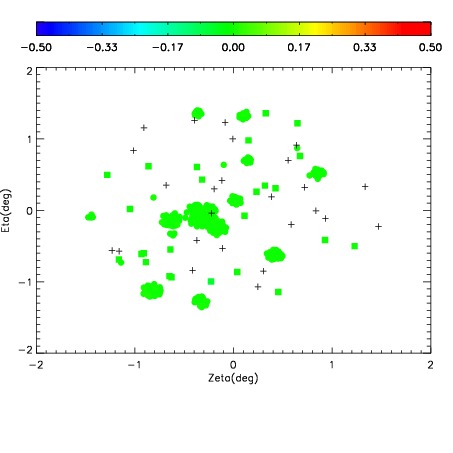
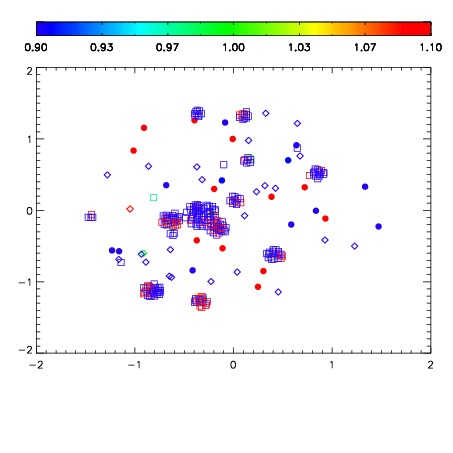
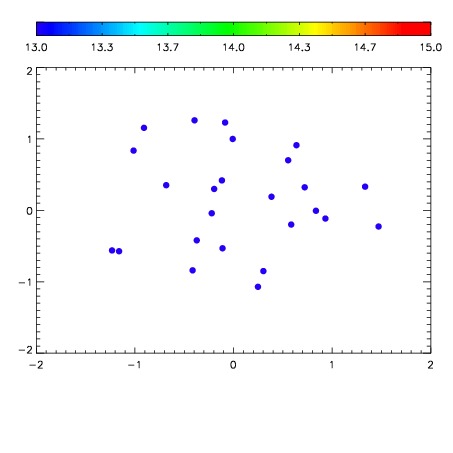

| Frame | Nreads | Zeropoints | Mag plots | Spatial mag deviation | Spatial sky 16325A emission deviations (filled: sky, open: star) | Spatial sky continuum emission | Spatial sky telluric CO2 absorption deviations (filled: H < 10) | |||||||||||||||||||||||
| 0 | 0 |
|
|
|
|
|
|
| 01400060 | 0.00000 | 248.994 |
| 01400061 | 0.00000 | 247.847 |
| 01400062 | 0.00000 | 253.874 |
| 01400063 | 0.00000 | 245.874 |
| 01400064 | 0.00000 | 246.409 |
| 01400065 | 0.00000 | 257.936 |