| Red | Green | Blue | |
| z | 17.64 | ||
| znorm | Inf | ||
| sky | -NaN | -Inf | -Inf |
| S/N | 32.9 | 48.6 | 62.3 |
| S/N(c) | 0.0 | 0.0 | 0.0 |
| SN(E/C) |
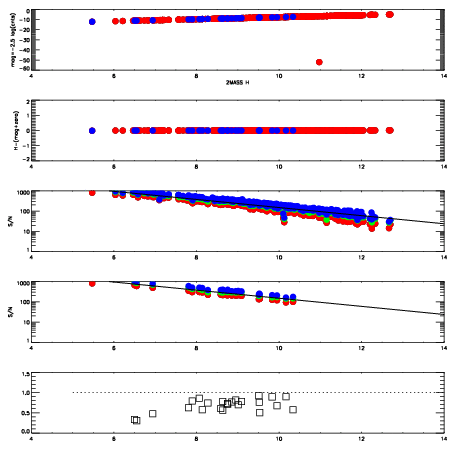
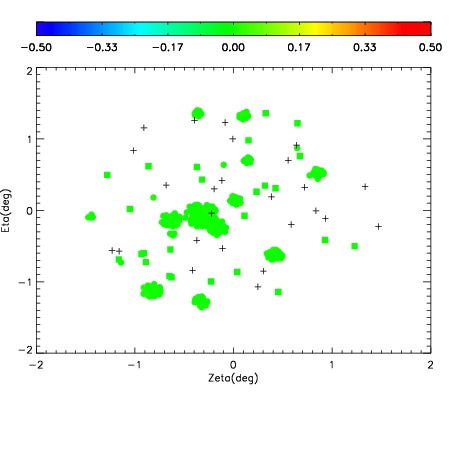
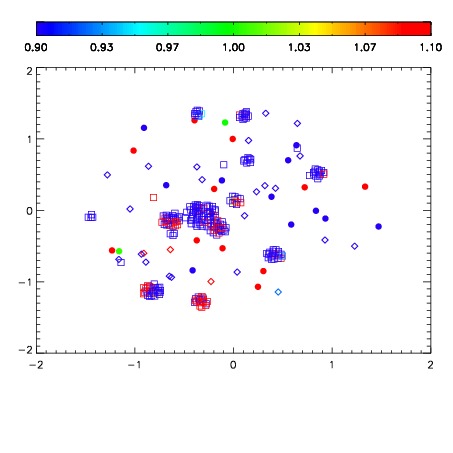
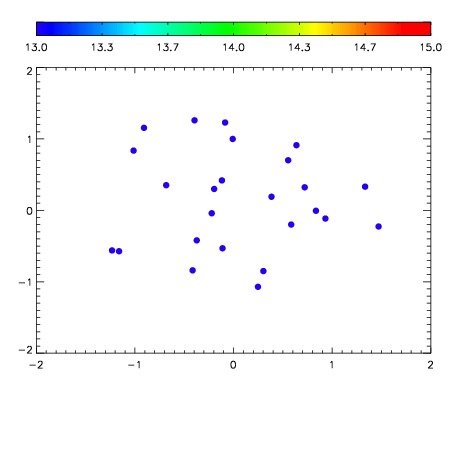

| Frame | Nreads | Zeropoints | Mag plots | Spatial mag deviation | Spatial sky 16325A emission deviations (filled: sky, open: star) | Spatial sky continuum emission | Spatial sky telluric CO2 absorption deviations (filled: H < 10) | |||||||||||||||||||||||
| 0 | 0 |
|
|
|
|
|
|
| 01410048 | 0.00000 | 237.788 |
| 01410049 | 0.00000 | 252.301 |
| 01410050 | 0.00000 | 248.126 |
| 01410051 | 0.00000 | 246.368 |
| 01410052 | 0.00000 | 251.000 |
| 01410053 | 0.00000 | 257.765 |