| Red | Green | Blue | |
| z | 17.64 | ||
| znorm | Inf | ||
| sky | -NaN | -Inf | -Inf |
| S/N | 23.5 | 37.7 | 49.7 |
| S/N(c) | 0.0 | 0.0 | 0.0 |
| SN(E/C) |

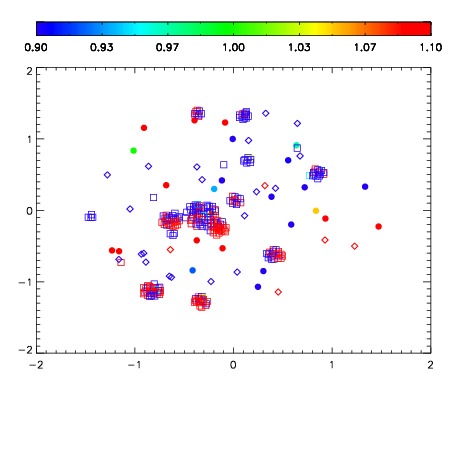


| Frame | Nreads | Zeropoints | Mag plots | Spatial mag deviation | Spatial sky 16325A emission deviations (filled: sky, open: star) | Spatial sky continuum emission | Spatial sky telluric CO2 absorption deviations (filled: H < 10) | |||||||||||||||||||||||
| 0 | 0 |
|
|
|
|
|
|
| 01710051 | 0.00000 | 167.924 |
| 01710052 | 0.00000 | 171.838 |
| 01710053 | 0.00000 | 179.446 |
| 01710054 | 0.00000 | 169.953 |
| 01710055 | 0.00000 | 161.739 |
| 01710056 | 0.00000 | 157.166 |
| 01710057 | 0.00000 | 150.480 |
| 01710058 | 0.00000 | 148.276 |