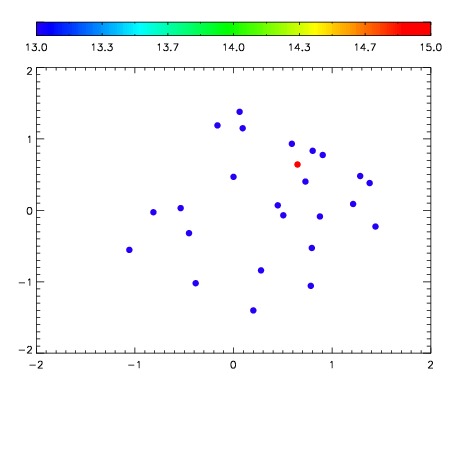
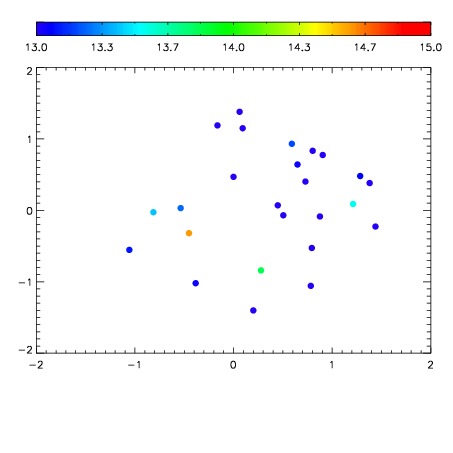
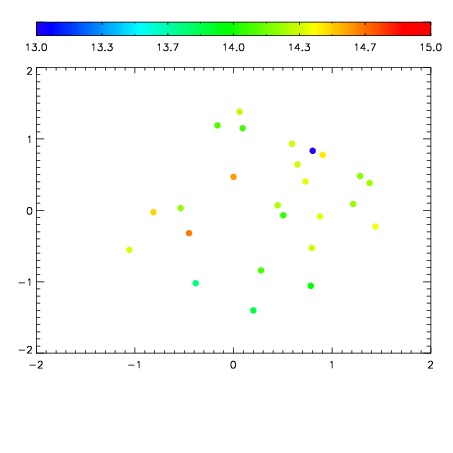
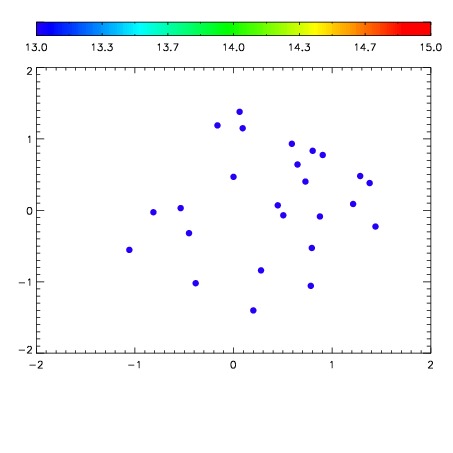
| Frame | Nreads | Zeropoints | Mag plots
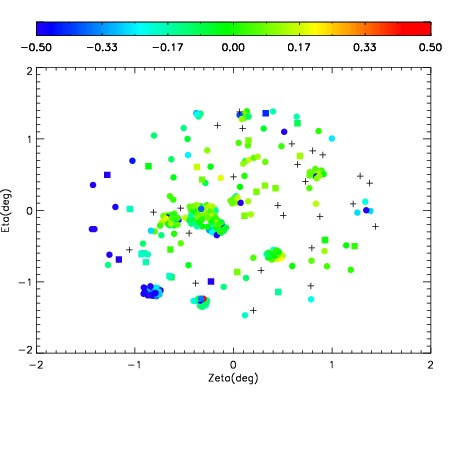
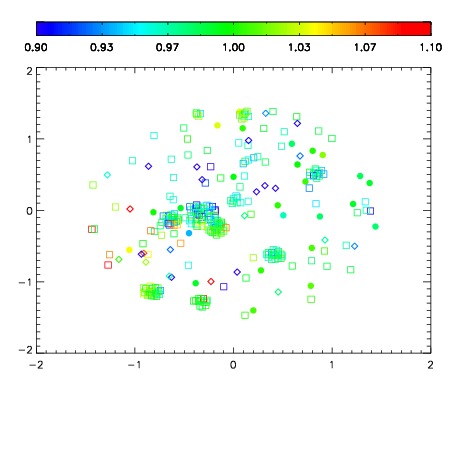
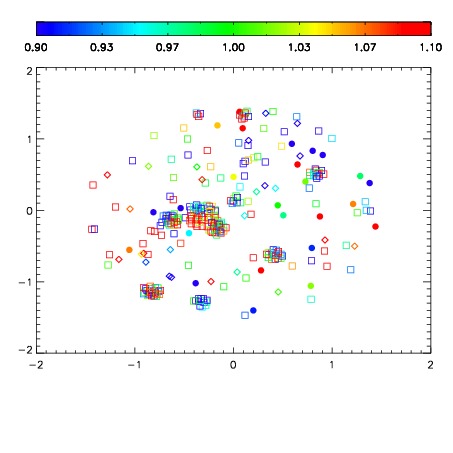
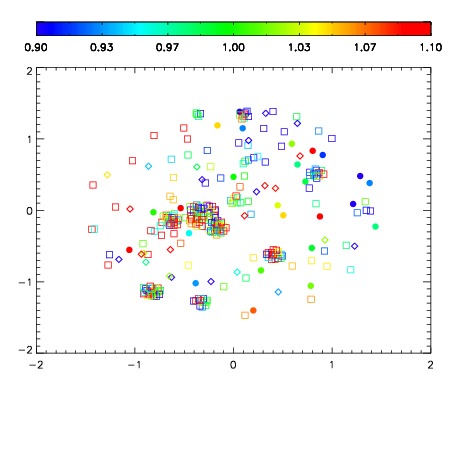
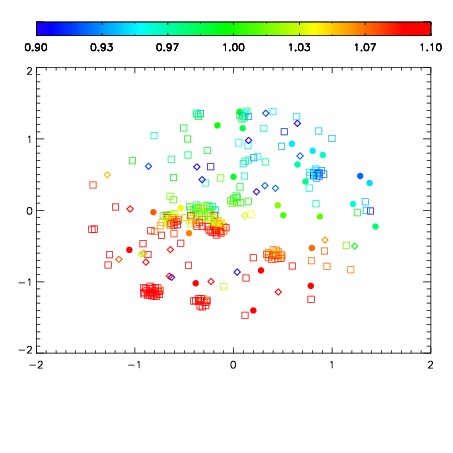
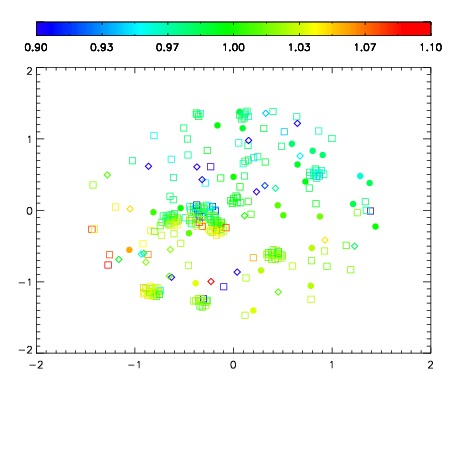
| Spatial mag deviation
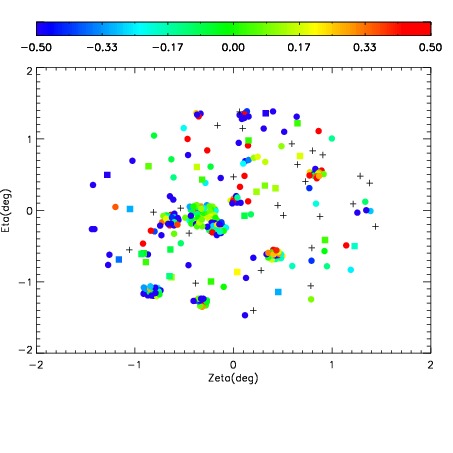
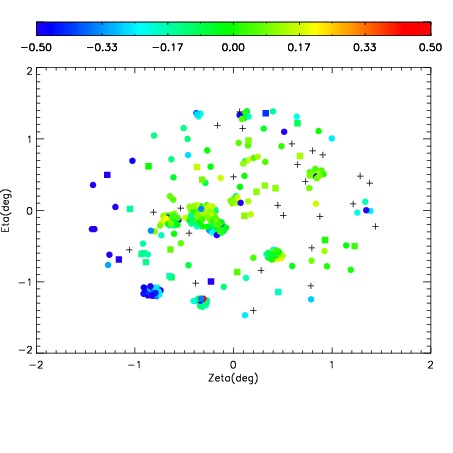
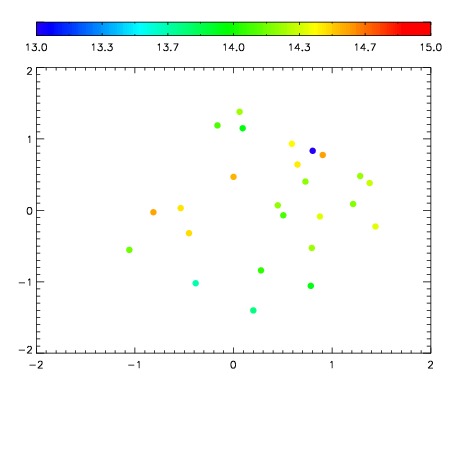
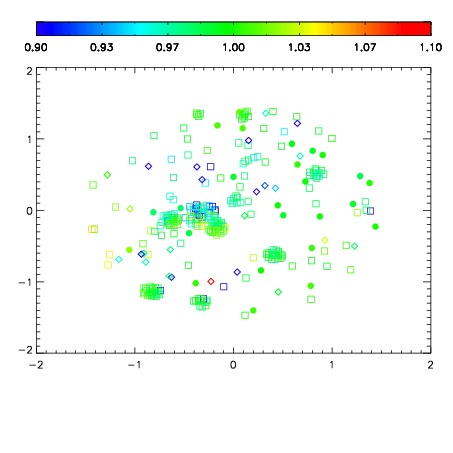
| Spatial sky 16325A emission deviations (filled: sky, open: star)
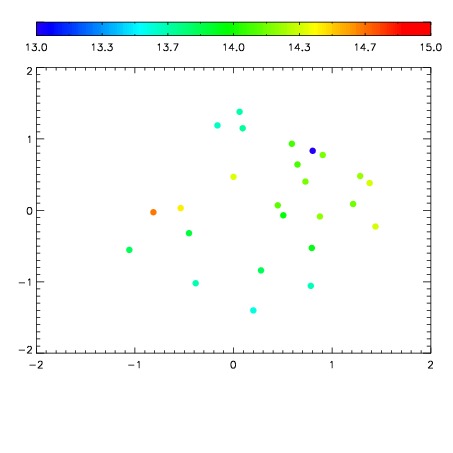
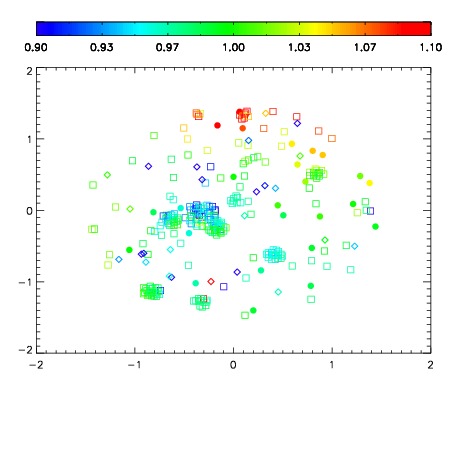
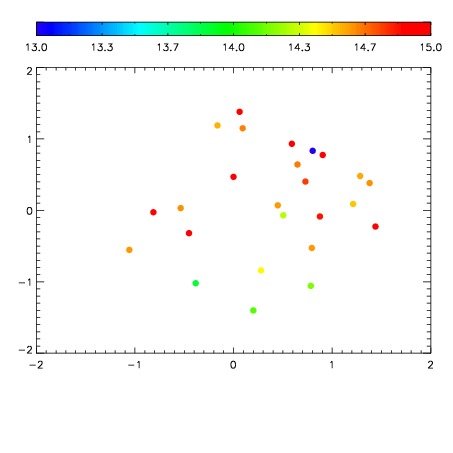
| Spatial sky continuum emission
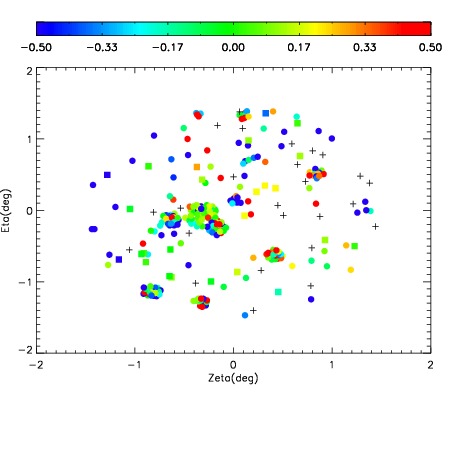
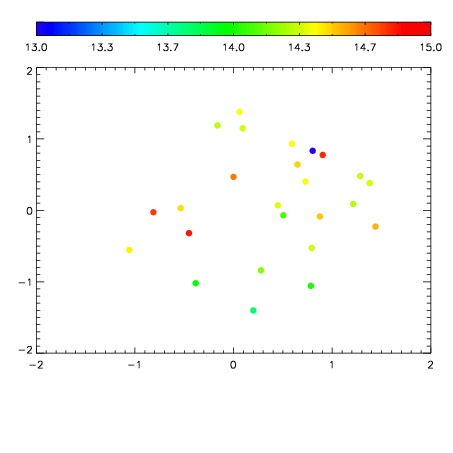
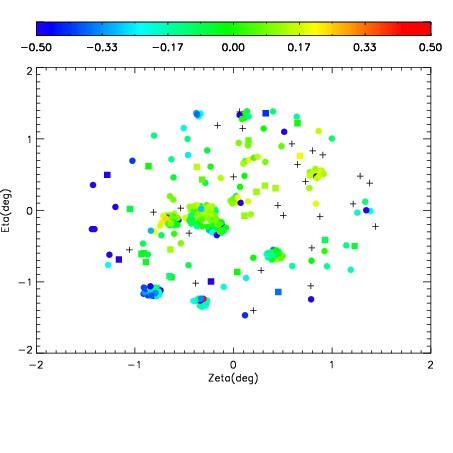
| Spatial sky telluric CO2 absorption deviations (filled: H < 10)
|
| 1400076
| 50
| | Red | Green | Blue
| | z | | 19.02
| | znorm | | 14.77
| | sky | 15.1 | 14.1 | 14.5
| | S/N | 14.5 | 21.6 | 25.4
| | S/N(c) | 12.8 | 20.1 | 23.1
| | SN(E/C) 0.81
|
| 
| 
| 
| 
| 
|
| 1400077
| 3
| | Red | Green | Blue
| | z | | 14.67
| | znorm | | 13.47
| | sky | -NaN | -NaN | 13.4
| | S/N | 0.0 | 0.3 | 0.4
| | S/N(c) | 0.0 | 0.2 | 0.3
| | SN(E/C) 0.92
|
| 
| 
| 
| 
| 
|
| 1400078
| 3
| | Red | Green | Blue
| | z | | 14.55
| | znorm | | 13.36
| | sky | -NaN | 12.9 | 15.1
| | S/N | 0.0 | 0.5 | 0.4
| | S/N(c) | 0.1 | 0.4 | 0.3
| | SN(E/C) 0.98
|
| 
| 
| 
| 
| 
|
| 1400079
| 50
| | Red | Green | Blue
| | z | | 18.96
| | znorm | | 14.71
| | sky | 14.7 | 14.2 | 14.7
| | S/N | 13.7 | 20.8 | 24.9
| | S/N(c) | 12.2 | 19.4 | 22.2
| | SN(E/C) 0.87
|
| 
| 
| 
| 
| 
|
| 1400080
| 50
| | Red | Green | Blue
| | z | | 19.05
| | znorm | | 14.80
| | sky | 14.9 | 14.4 | 14.6
| | S/N | 14.6 | 21.6 | 26.1
| | S/N(c) | 13.1 | 20.6 | 23.0
| | SN(E/C) 0.83
|
| 
| 
| 
| 
| 
|
| 1400081
| 50
| | Red | Green | Blue
| | z | | 18.98
| | znorm | | 14.73
| | sky | 14.9 | 14.6 | 14.8
| | S/N | 14.0 | 20.8 | 24.8
| | S/N(c) | 12.1 | 19.7 | 21.8
| | SN(E/C) 0.80
|
| 
| 
| 
| 
| 
|
| 1400082
| 50
| | Red | Green | Blue
| | z | | 18.96
| | znorm | | 14.71
| | sky | 14.7 | 14.3 | 14.5
| | S/N | 13.7 | 21.0 | 24.3
| | S/N(c) | 12.2 | 19.6 | 21.7
| | SN(E/C) 0.84
|
| 
| 
| 
| 
| 
|
| 1400083
| 50
| | Red | Green | Blue
| | z | | 18.79
| | znorm | | 14.54
| | sky | 12.9 | 12.6 | 12.4
| | S/N | 10.8 | 15.7 | 18.1
| | S/N(c) | 9.9 | 15.2 | 16.2
| | SN(E/C) 0.81
|
| 
| 
| 
| 
| 
|