| Red | Green | Blue | |
| z | 17.64 | ||
| znorm | Inf | ||
| sky | -NaN | -NaN | -Inf |
| S/N | 29.6 | 47.0 | 52.6 |
| S/N(c) | 0.0 | 0.0 | 0.0 |
| SN(E/C) |
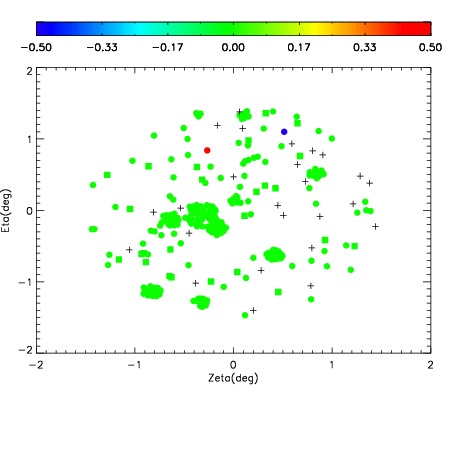

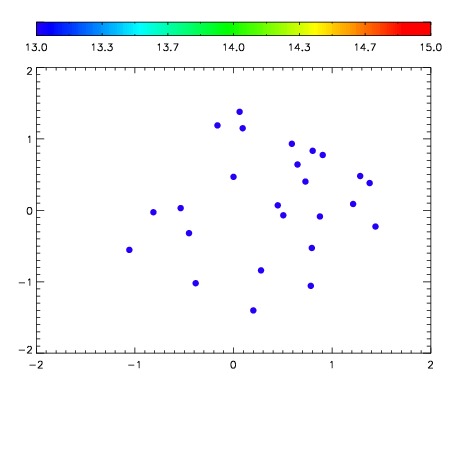

| Frame | Nreads | Zeropoints | Mag plots | Spatial mag deviation | Spatial sky 16325A emission deviations (filled: sky, open: star) | Spatial sky continuum emission | Spatial sky telluric CO2 absorption deviations (filled: H < 10) | |||||||||||||||||||||||
| 0 | 0 |
|
|
|
|
|
|
| 01400076 | 0.00000 | 181.214 |
| 01400077 | 0.00000 | 17.5093 |
| 01400078 | 0.00000 | 14.7471 |
| 01400079 | 0.00000 | 178.248 |
| 01400080 | 0.00000 | 185.919 |
| 01400081 | 0.00000 | 179.124 |
| 01400082 | 0.00000 | 179.519 |
| 01400083 | 0.00000 | 162.558 |