| Red | Green | Blue | |
| z | 17.63 | ||
| znorm | Inf | ||
| sky | -NaN | -NaN | -Inf |
| S/N | 45.3 | 77.5 | 87.6 |
| S/N(c) | 0.0 | 0.0 | 0.0 |
| SN(E/C) |
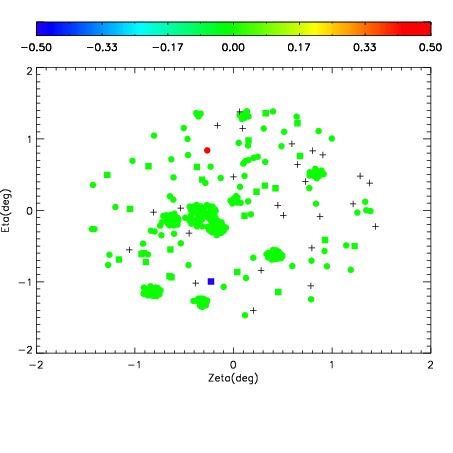
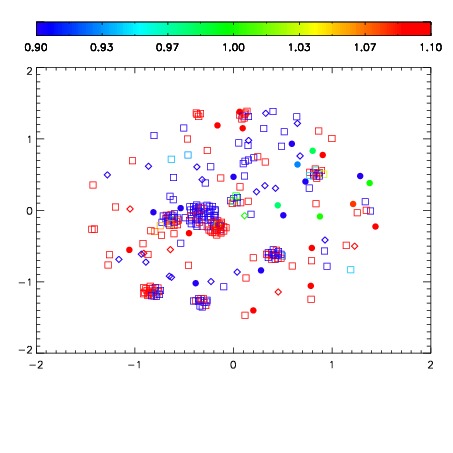


| Frame | Nreads | Zeropoints | Mag plots | Spatial mag deviation | Spatial sky 16325A emission deviations (filled: sky, open: star) | Spatial sky continuum emission | Spatial sky telluric CO2 absorption deviations (filled: H < 10) | |||||||||||||||||||||||
| 0 | 0 |
|
|
|
|
|
|
| 01410027 | 0.00000 | 102.369 |
| 01410028 | 0.00000 | 117.945 |
| 01410029 | 0.00000 | 126.658 |
| 01410030 | 0.00000 | 138.057 |
| 01410031 | 0.00000 | 143.690 |
| 01410032 | 0.00000 | 146.614 |
| 01410033 | 0.00000 | 151.220 |
| 01410034 | 0.00000 | 157.493 |
| 01410035 | 0.00000 | 163.937 |
| 01410036 | 0.00000 | 172.849 |
| 01410037 | 0.00000 | 172.453 |
| 01410038 | 0.00000 | 171.130 |
| 01410039 | 0.00000 | 171.584 |
| 01410040 | 0.00000 | 163.948 |