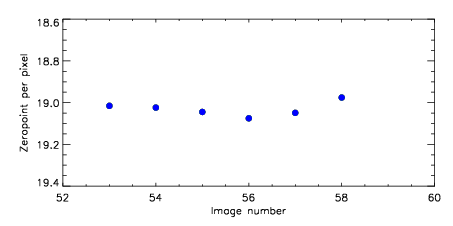
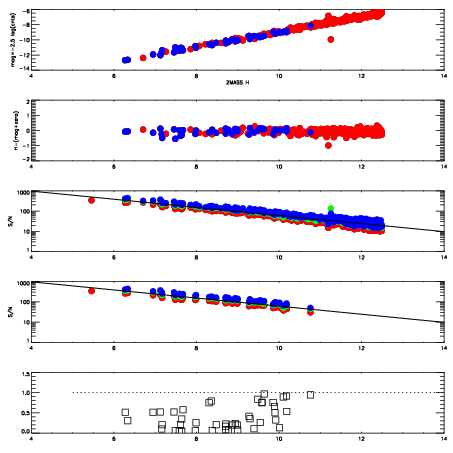
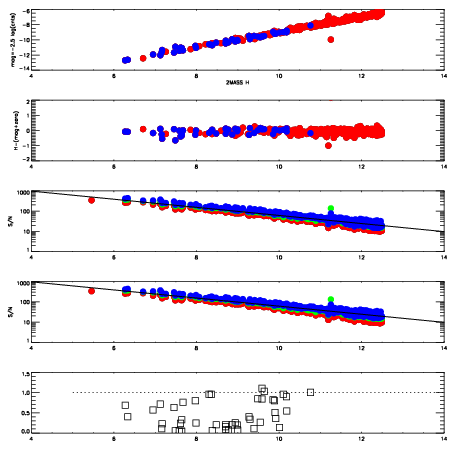
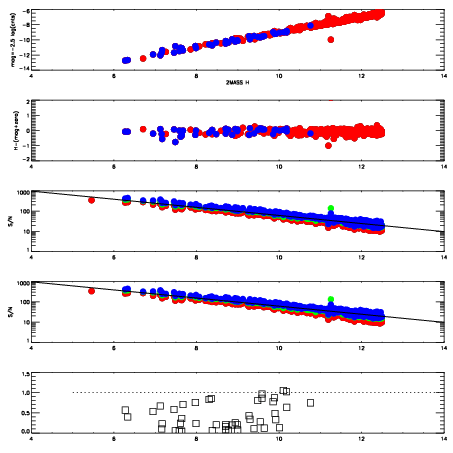
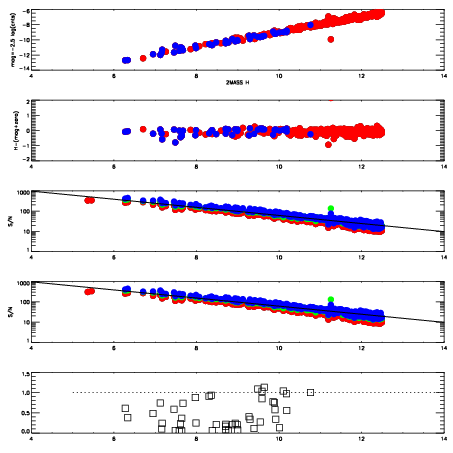
| Frame | Nreads | Zeropoints | Mag plots
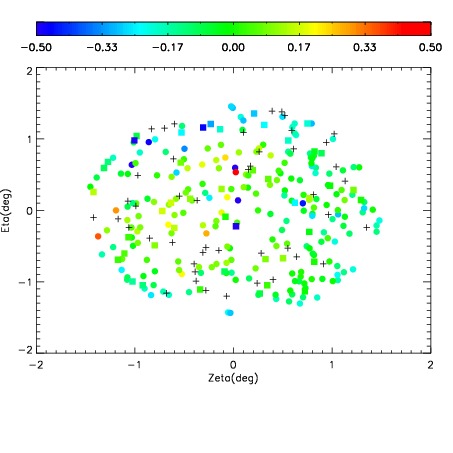
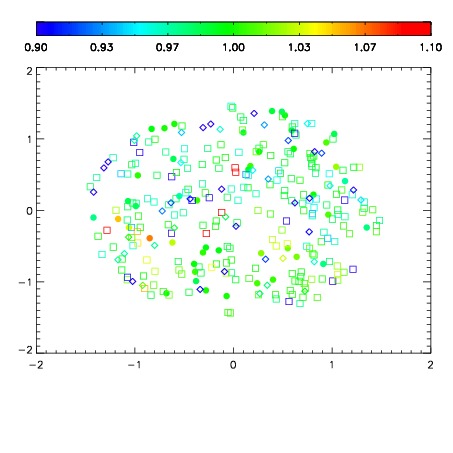
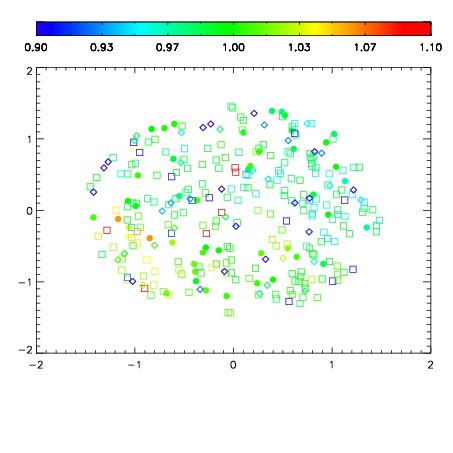
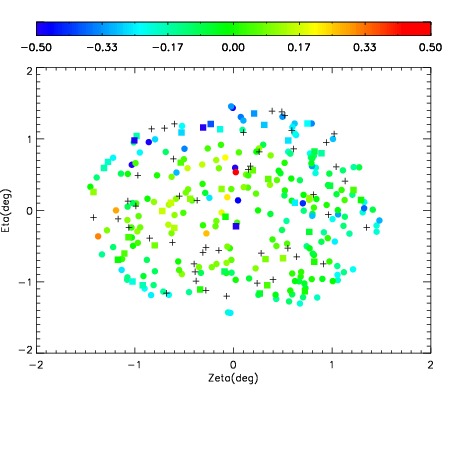
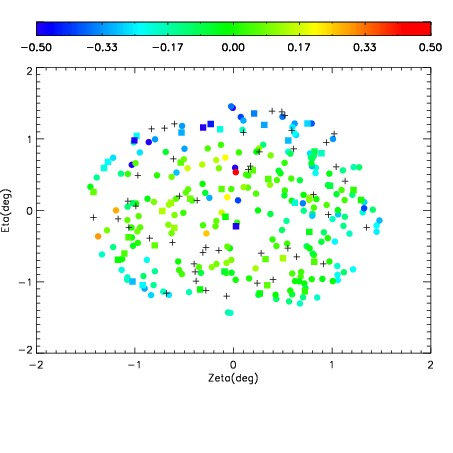
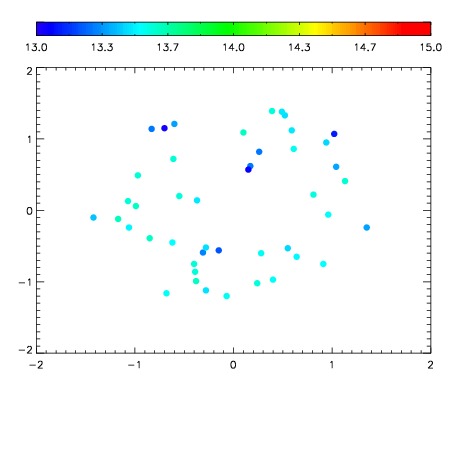
| Spatial mag deviation
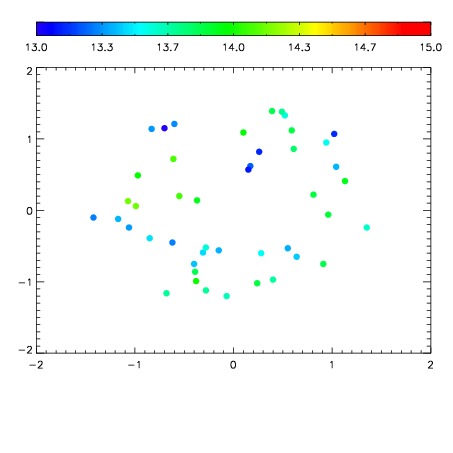
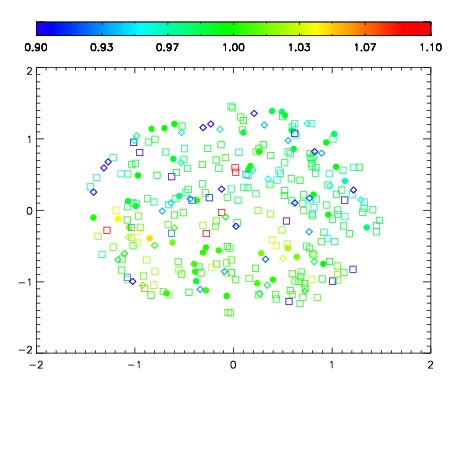
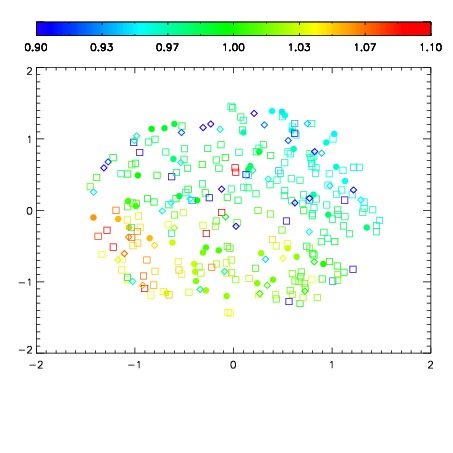
| Spatial sky 16325A emission deviations (filled: sky, open: star)
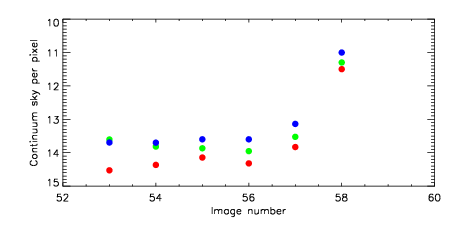
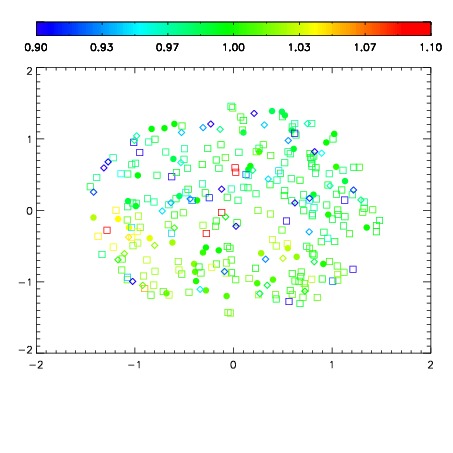
| Spatial sky continuum emission
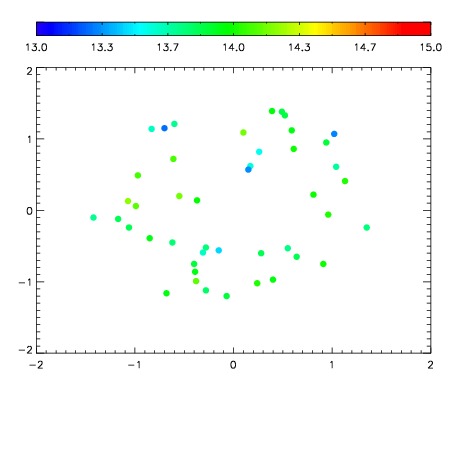
| Spatial sky telluric CO2 absorption deviations (filled: H < 10)
|
| 1420053
| 50
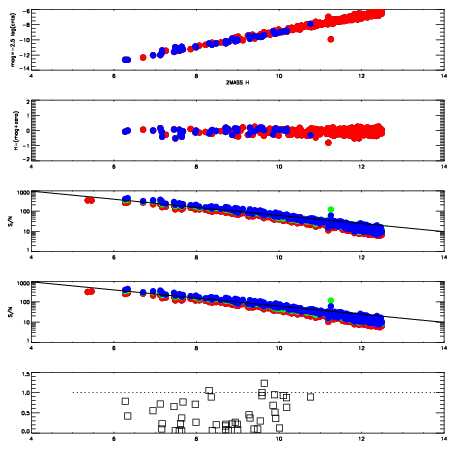
| | Red | Green | Blue
| | z | | 19.02
| | znorm | | 14.77
| | sky | 14.5 | 13.6 | 13.7
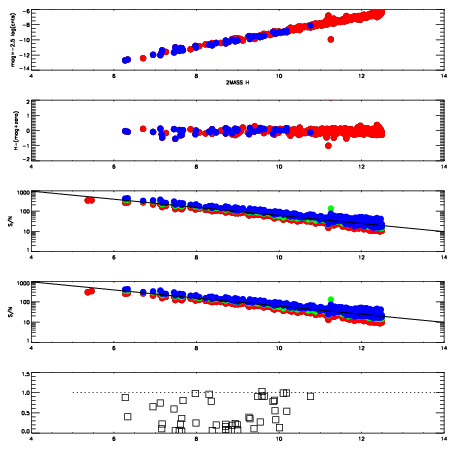
| | S/N | 15.7 | 21.7 | 24.4
| | S/N(c) | 13.8 | 20.3 | 24.2
| | SN(E/C) 0.36
|
| 
| 
| 
| 
| 
|
| 1420054
| 50
| | Red | Green | Blue
| | z | | 19.02
| | znorm | | 14.78
| | sky | 14.4 | 13.8 | 13.7
| | S/N | 15.5 | 21.8 | 23.8
| | S/N(c) | 0.0 | 0.0 | 0.0
| | SN(E/C) 0.32
|
| 
| 
| 
| 
| 
|
| 1420055
| 50
| | Red | Green | Blue
| | z | | 19.04
| | znorm | | 14.80
| | sky | 14.1 | 13.9 | 13.6
| | S/N | 15.4 | 21.9 | 23.7
| | S/N(c) | 13.6 | 20.6 | 23.3
| | SN(E/C) 0.36
|
| 
| 
| 
| 
| 
|
| 1420056
| 50
| | Red | Green | Blue
| | z | | 19.08
| | znorm | | 14.83
| | sky | 14.3 | 14.0 | 13.6
| | S/N | 16.0 | 22.5 | 24.1
| | S/N(c) | 13.8 | 20.7 | 23.7
| | SN(E/C) 0.34
|
| 
| 
| 
| 
| 
|
| 1420057
| 50
| | Red | Green | Blue
| | z | | 19.05
| | znorm | | 14.80
| | sky | 13.8 | 13.5 | 13.1
| | S/N | 15.4 | 21.8 | 22.6
| | S/N(c) | 13.5 | 19.5 | 22.5
| | SN(E/C) 0.37
|
| 
| 
| 
| 
| 
|
| 1420058
| 50
| | Red | Green | Blue
| | z | | 18.98
| | znorm | | 14.73
| | sky | 11.5 | 11.3 | 11.0
| | S/N | 10.8 | 13.4 | 14.4
| | S/N(c) | 10.0 | 12.6 | 14.4
| | SN(E/C) 0.37
|
| 
| 
| 
| 
| 
|