| Red | Green | Blue | |
| z | 17.64 | ||
| znorm | Inf | ||
| sky | -NaN | -Inf | -Inf |
| S/N | 46.1 | 70.9 | 84.0 |
| S/N(c) | 46.1 | 70.9 | 84.0 |
| SN(E/C) |
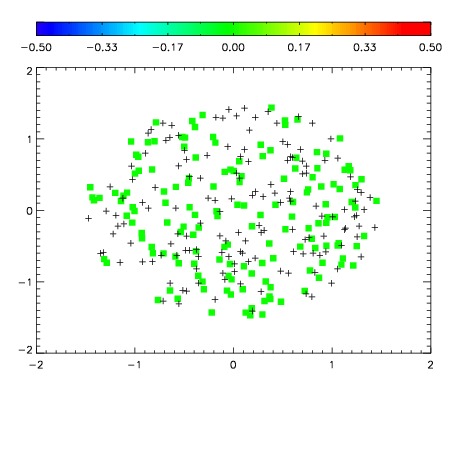
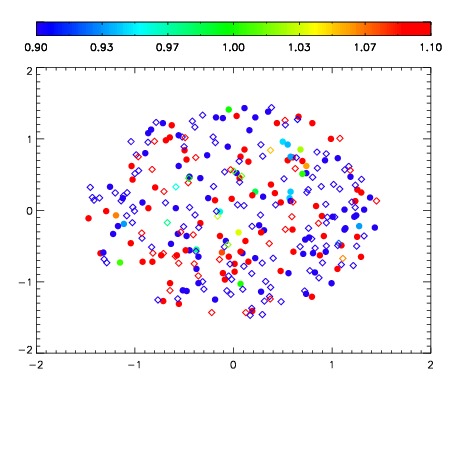


| Frame | Nreads | Zeropoints | Mag plots | Spatial mag deviation | Spatial sky 16325A emission deviations (filled: sky, open: star) | Spatial sky continuum emission | Spatial sky telluric CO2 absorption deviations (filled: H < 10) | |||||||||||||||||||||||
| 0 | 0 |
|
|
|
|
|
|
| 01630075 | 0.00000 | 260.457 |
| 01630076 | 0.00000 | 254.416 |
| 01630077 | 0.00000 | 257.894 |
| 01630078 | 0.00000 | 252.945 |
| 01630079 | 0.00000 | 261.426 |
| 01630080 | 0.00000 | 258.118 |
| 01630081 | 0.00000 | 254.728 |
| 01630082 | 0.00000 | 255.393 |