| Red | Green | Blue | |
| z | 17.64 | ||
| znorm | Inf | ||
| sky | -NaN | -NaN | -Inf |
| S/N | 74.4 | 115.9 | 135.3 |
| S/N(c) | 74.4 | 115.9 | 135.3 |
| SN(E/C) |
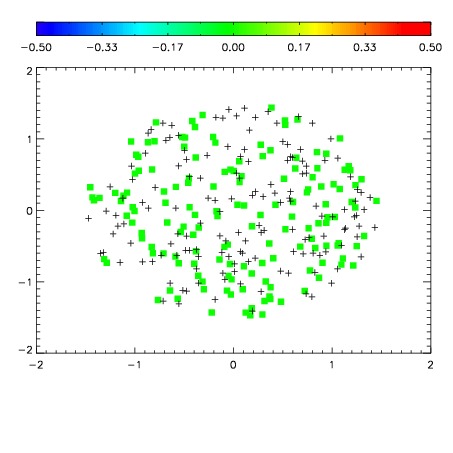
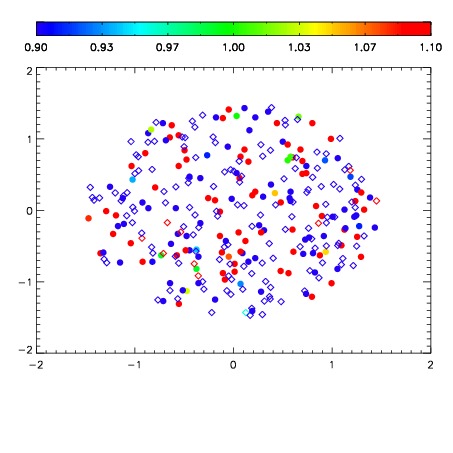
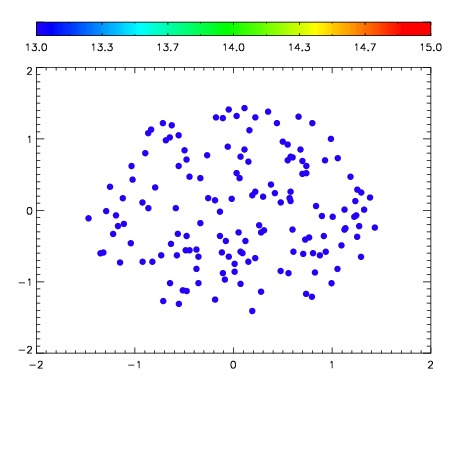

| Frame | Nreads | Zeropoints | Mag plots | Spatial mag deviation | Spatial sky 16325A emission deviations (filled: sky, open: star) | Spatial sky continuum emission | Spatial sky telluric CO2 absorption deviations (filled: H < 10) | |||||||||||||||||||||||
| 0 | 0 |
|
|
|
|
|
|
| 01640055 | 0.00000 | 249.804 |
| 01640056 | 0.00000 | 261.814 |
| 01640057 | 0.00000 | 259.346 |
| 01640058 | 0.00000 | 267.511 |
| 01640059 | 0.00000 | 261.693 |
| 01640060 | 0.00000 | 267.369 |
| 01640061 | 0.00000 | 268.665 |
| 01640062 | 0.00000 | 268.898 |
| 01640063 | 0.00000 | 269.772 |
| 01640064 | 0.00000 | 267.647 |
| 01640065 | 0.00000 | 254.021 |
| 01640066 | 0.00000 | 256.425 |
| 01640067 | 0.00000 | 186.574 |
| 01640068 | 0.00000 | 187.205 |
| 01640069 | 0.00000 | 188.618 |
| 01640070 | 0.00000 | 188.273 |
| 01640071 | 0.00000 | 188.468 |
| 01640072 | 0.00000 | 268.009 |
| 01640073 | 0.00000 | 264.863 |
| 01640074 | 0.00000 | 262.056 |
| 01640075 | 0.00000 | 258.513 |
| 01640076 | 0.00000 | 255.161 |