| Frame | Nreads | Zeropoints | Mag plots
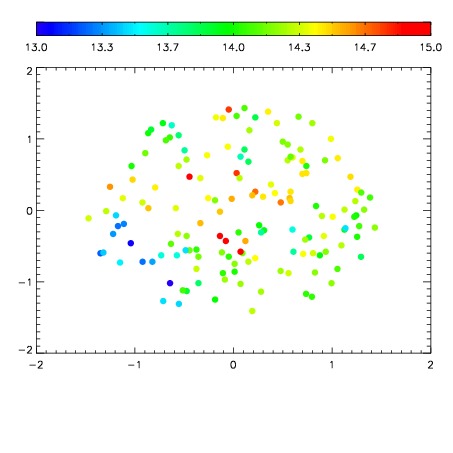
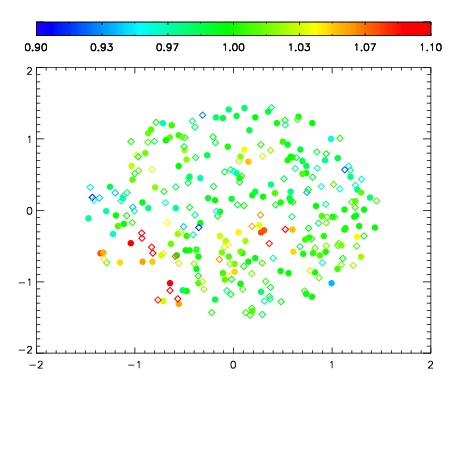
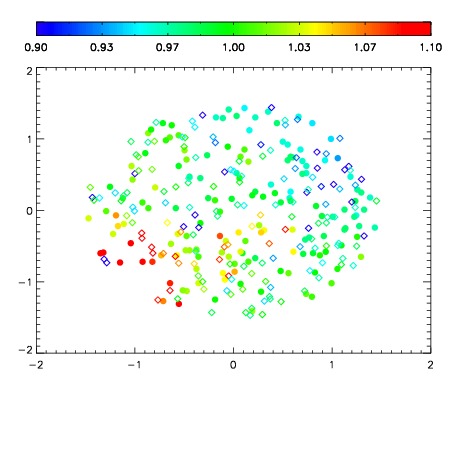
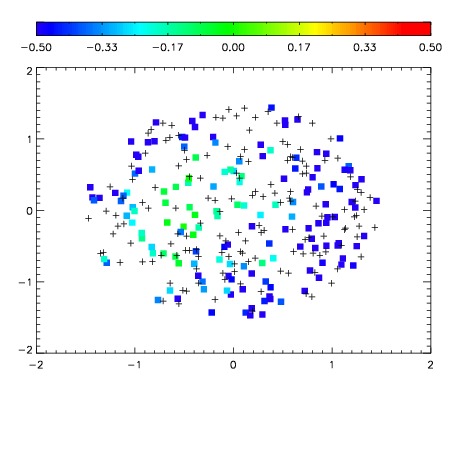
| Spatial mag deviation
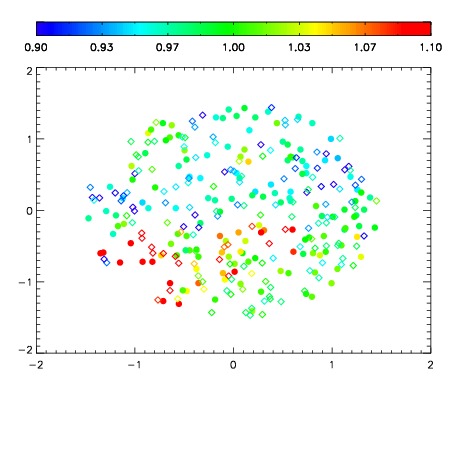
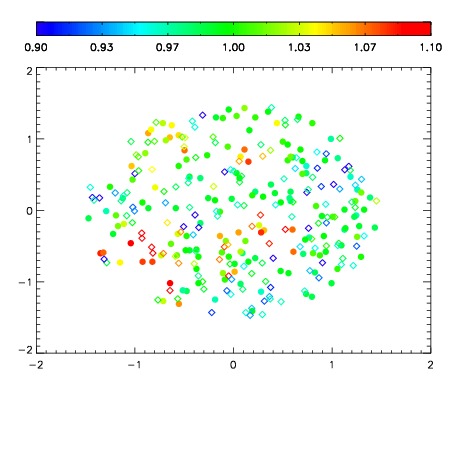
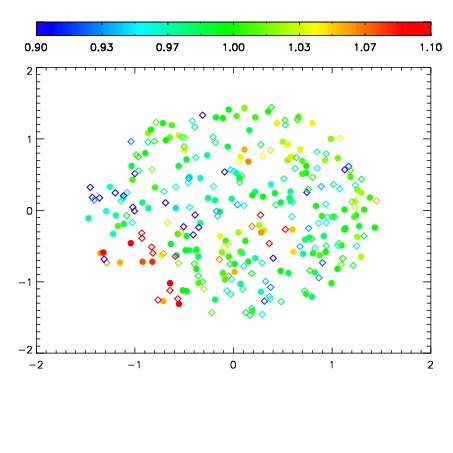
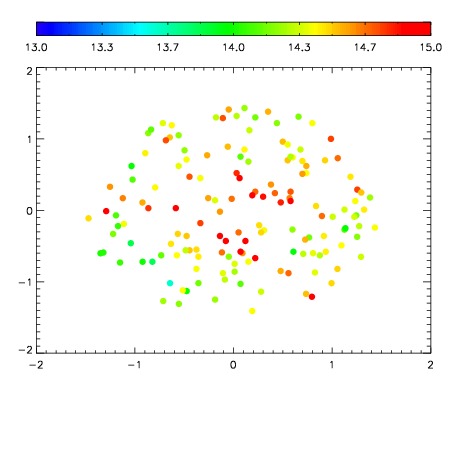
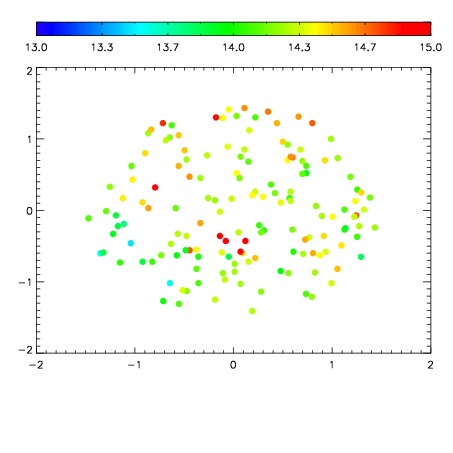
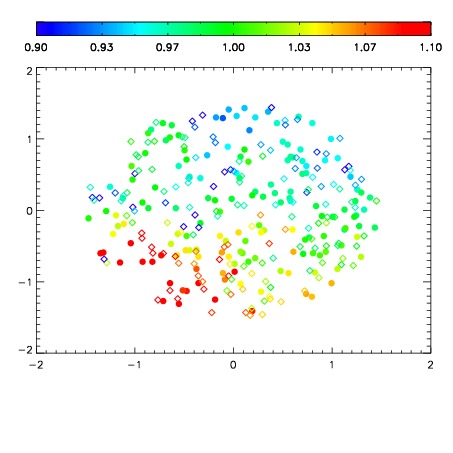
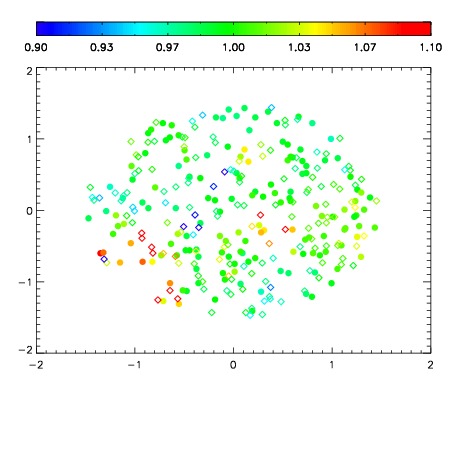
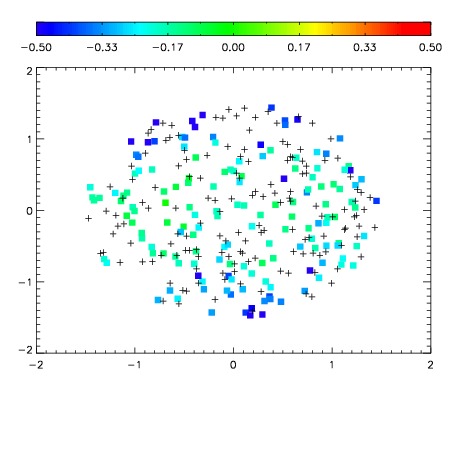
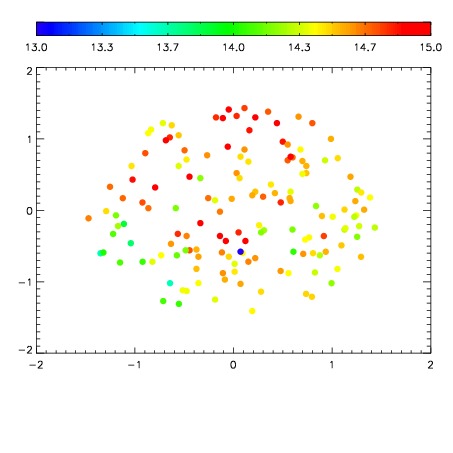
| Spatial sky 16325A emission deviations (filled: sky, open: star)
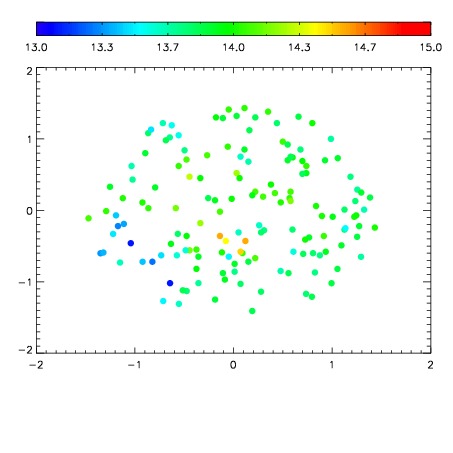
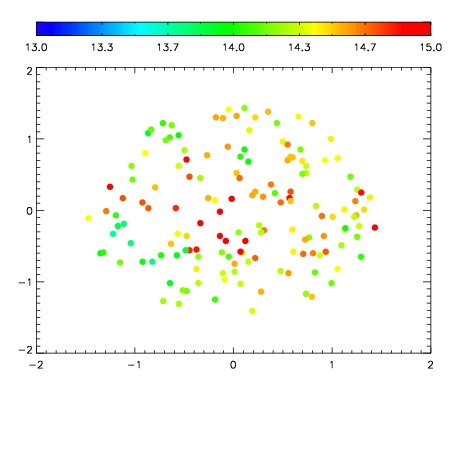
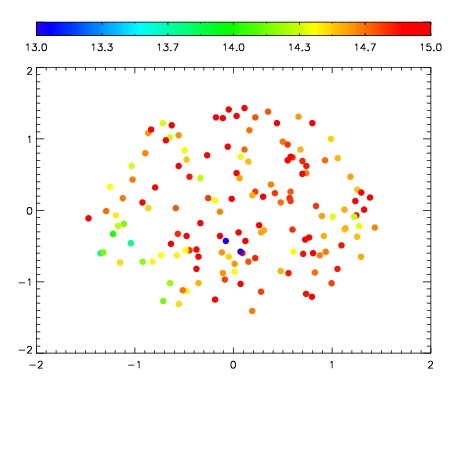
| Spatial sky continuum emission
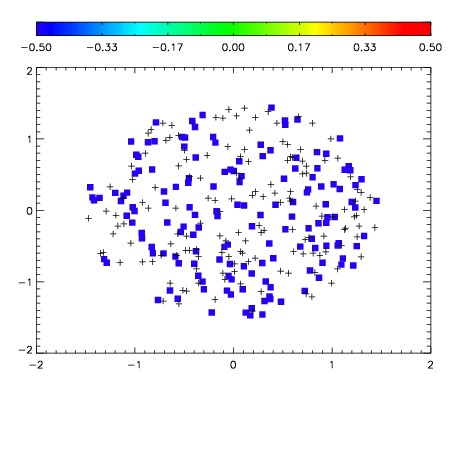
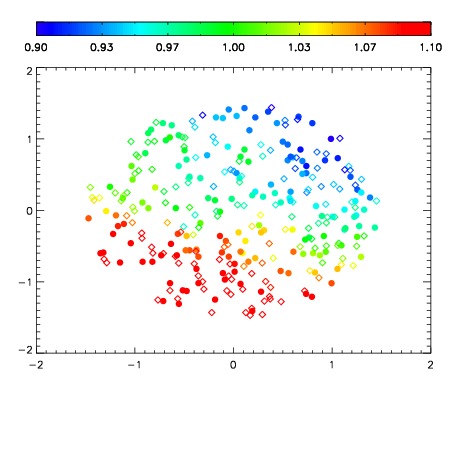
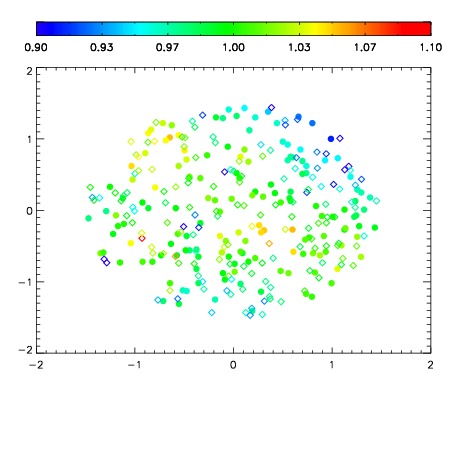
| Spatial sky telluric CO2 absorption deviations (filled: H < 10)
|
| 1650062
| 25
| | Red | Green | Blue
| | z | | *****
| | znorm | | 99.44
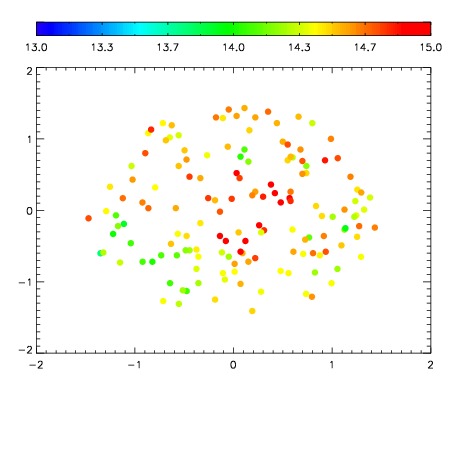
| | sky | 14.5 | 14.2 | 14.5
| | S/N | 10.9 | 17.6 | 20.4
| | S/N(c) | 9.9 | 17.2 | 19.5
| | SN(E/C) 0.93
|
| 
| 
| 
| 
| 
|
| 1650063
| 25
| | Red | Green | Blue
| | z | | *****
| | znorm | | *****
| | sky | 14.3 | 13.9 | 14.4
| | S/N | 9.9 | 16.8 | 18.5
| | S/N(c) | 9.2 | 16.4 | 17.8
| | SN(E/C) 0.92
|
| 
| 
| 
| 
| 
|
| 1650064
| 25
| | Red | Green | Blue
| | z | | *****
| | znorm | | 96.53
| | sky | 14.7 | 14.4 | 14.4
| | S/N | 7.2 | 12.7 | 14.0
| | S/N(c) | 6.4 | 12.3 | 13.5
| | SN(E/C) 0.95
|
| 
| 
| 
| 
| 
|
| 1650065
| 25
| | Red | Green | Blue
| | z | | *****
| | znorm | | 98.21
| | sky | 14.8 | 14.4 | 14.6
| | S/N | 2.9 | 6.3 | 7.3
| | S/N(c) | 2.5 | 5.8 | 6.9
| | SN(E/C) 0.97
|
| 
| 
| 
| 
| 
|
| 1650066
| 25
| | Red | Green | Blue
| | z | | *****
| | znorm | | 98.74
| | sky | 14.3 | 14.3 | 14.4
| | S/N | 11.3 | 18.6 | 20.4
| | S/N(c) | 10.4 | 18.1 | 19.7
| | SN(E/C) 0.92
|
| 
| 
| 
| 
| 
|
| 1650067
| 25
| | Red | Green | Blue
| | z | | 18.42
| | znorm | | 14.93
| | sky | 15.0 | 14.7 | 14.6
| | S/N | 9.2 | 15.6 | 17.9
| | S/N(c) | 8.3 | 15.0 | 17.3
| | SN(E/C) 0.93
|
| 
| 
| 
| 
| 
|
| 1650068
| 25
| | Red | Green | Blue
| | z | | *****
| | znorm | | 97.46
| | sky | 14.1 | 14.3 | 14.8
| | S/N | 6.0 | 10.9 | 12.6
| | S/N(c) | 5.2 | 10.3 | 12.0
| | SN(E/C) 0.94
|
| 
| 
| 
| 
| 
|
| 1650069
| 25
| | Red | Green | Blue
| | z | | 99.17
| | znorm | | 95.67
| | sky | 14.5 | 14.5 | 14.5
| | S/N | 1.8 | 4.7 | 5.2
| | S/N(c) | 1.7 | 4.2 | 4.8
| | SN(E/C) 0.93
|
| 
| 
| 
| 
| 
|
| 1650070
| 25
| | Red | Green | Blue
| | z | | 18.51
| | znorm | | 15.02
| | sky | 14.2 | 14.5 | 14.4
| | S/N | 11.5 | 18.6 | 20.4
| | S/N(c) | 10.3 | 18.0 | 19.8
| | SN(E/C) 0.91
|
| 
| 
| 
| 
| 
|