| Red | Green | Blue | |
| z | 17.64 | ||
| znorm | Inf | ||
| sky | -Inf | -Inf | -Inf |
| S/N | 23.0 | 41.9 | 46.4 |
| S/N(c) | 23.0 | 41.9 | 46.4 |
| SN(E/C) |

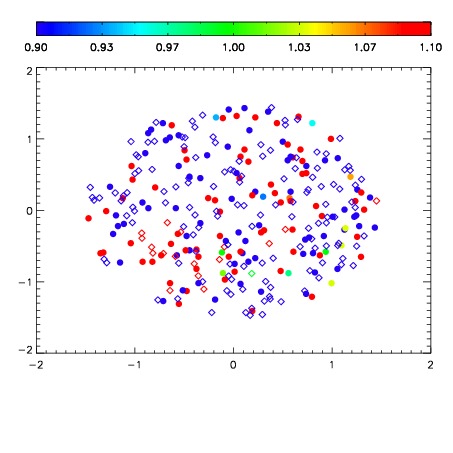
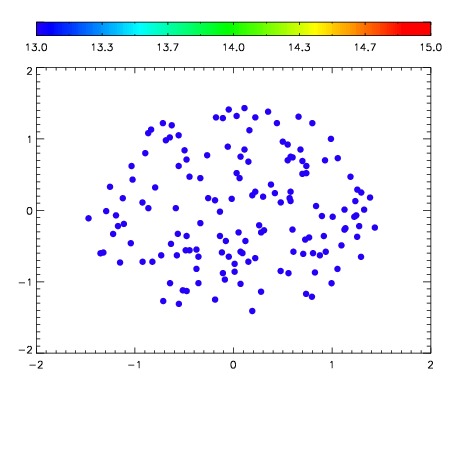

| Frame | Nreads | Zeropoints | Mag plots | Spatial mag deviation | Spatial sky 16325A emission deviations (filled: sky, open: star) | Spatial sky continuum emission | Spatial sky telluric CO2 absorption deviations (filled: H < 10) | |||||||||||||||||||||||
| 0 | 0 |
|
|
|
|
|
|
| 01650062 | 0.00000 | 191.284 |
| 01650063 | 0.00000 | 167.090 |
| 01650064 | 0.00000 | 106.292 |
| 01650065 | 0.00000 | 50.1960 |
| 01650066 | 0.00000 | 191.074 |
| 01650067 | 0.00000 | 176.919 |
| 01650068 | 0.00000 | 124.070 |
| 01650069 | 0.00000 | 61.7053 |
| 01650070 | 0.00000 | 192.039 |