| Red | Green | Blue | |
| z | 17.64 | ||
| znorm | Inf | ||
| sky | -Inf | -Inf | -Inf |
| S/N | 22.1 | 33.1 | 38.9 |
| S/N(c) | 22.1 | 33.1 | 38.9 |
| SN(E/C) |
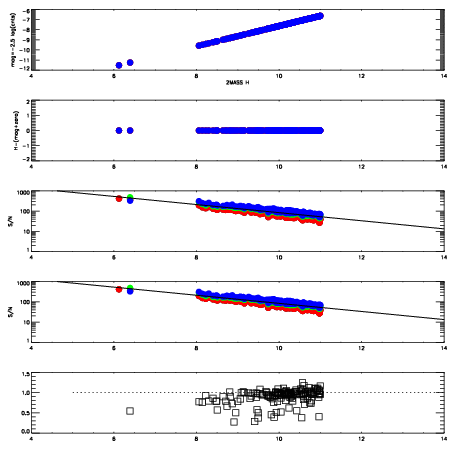
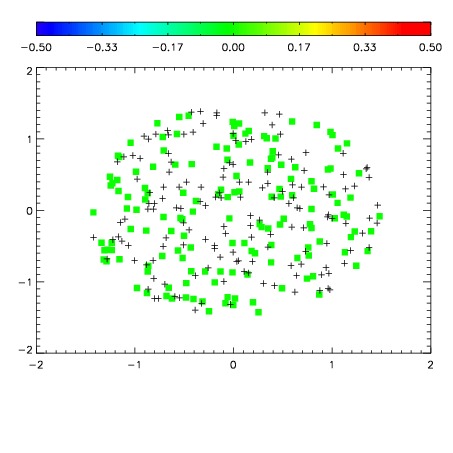
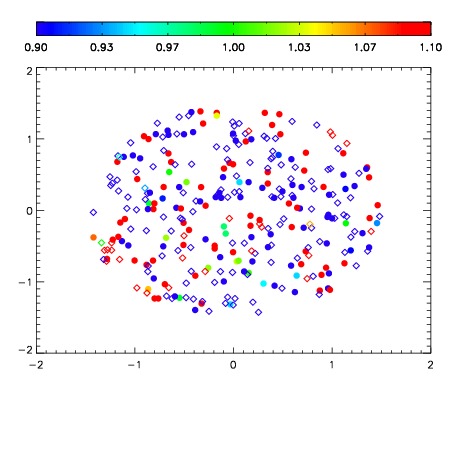
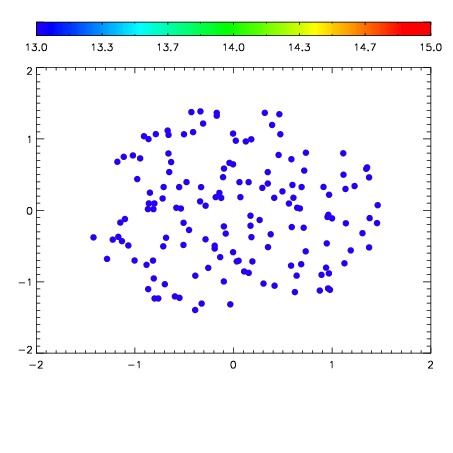

| Frame | Nreads | Zeropoints | Mag plots | Spatial mag deviation | Spatial sky 16325A emission deviations (filled: sky, open: star) | Spatial sky continuum emission | Spatial sky telluric CO2 absorption deviations (filled: H < 10) | |||||||||||||||||||||||
| 0 | 0 |
|
|
|
|
|
|
| IPAIR | NAME | SHIFT | NEWSHIFT | S/N | NAME | SHIFT | NEWSHIFT | S/N |
| 0 | 02450035 | 0.425158 | 0.00000 | 210.224 | 02450033 | 0.00000 | 0.425158 | 196.932 |
| 1 | 02450034 | 0.424753 | 0.000404984 | 207.054 | 02450036 | 0.00735543 | 0.417803 | 194.309 |