| Red | Green | Blue | |
| z | 17.64 | ||
| znorm | Inf | ||
| sky | -Inf | -Inf | -Inf |
| S/N | 14.2 | 22.9 | 27.2 |
| S/N(c) | 14.2 | 22.9 | 27.2 |
| SN(E/C) |
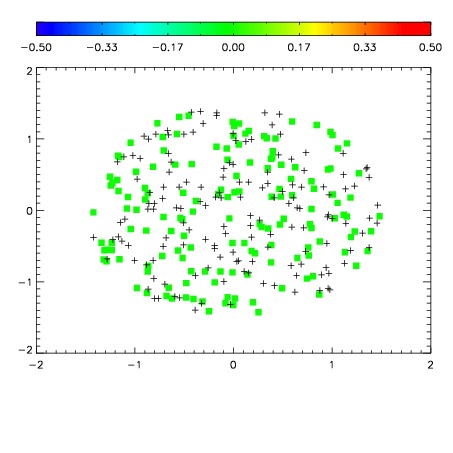
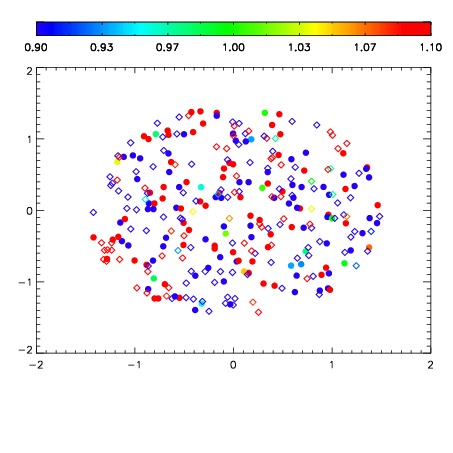
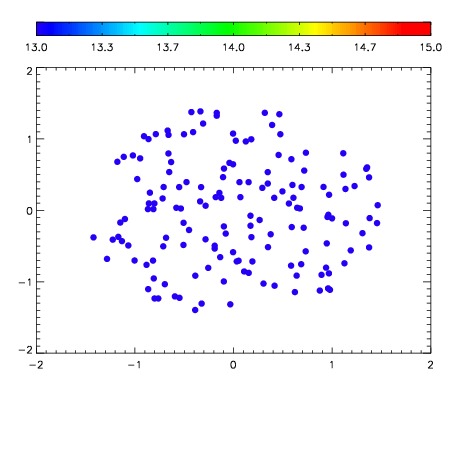

| Frame | Nreads | Zeropoints | Mag plots | Spatial mag deviation | Spatial sky 16325A emission deviations (filled: sky, open: star) | Spatial sky continuum emission | Spatial sky telluric CO2 absorption deviations (filled: H < 10) | |||||||||||||||||||||||
| 0 | 0 |
|
|
|
|
|
|
| IPAIR | NAME | SHIFT | NEWSHIFT | S/N | NAME | SHIFT | NEWSHIFT | S/N |
| 0 | 02540039 | 0.406474 | 0.00000 | 73.8208 | 02540040 | 0.00290855 | 0.403565 | 51.9385 |
| 1 | 02540038 | 0.403073 | 0.00340098 | 185.464 | 02540037 | -0.00213005 | 0.408604 | 159.573 |
| 2 | 02540035 | 0.406132 | 0.000341982 | 79.3056 | 02540034 | 0.00000 | 0.406474 | 107.837 |