| Red | Green | Blue | |
| z | 17.64 | ||
| znorm | Inf | ||
| sky | -NaN | -Inf | -Inf |
| S/N | 57.7 | 80.1 | 81.9 |
| S/N(c) | 0.0 | 0.0 | 0.0 |
| SN(E/C) |
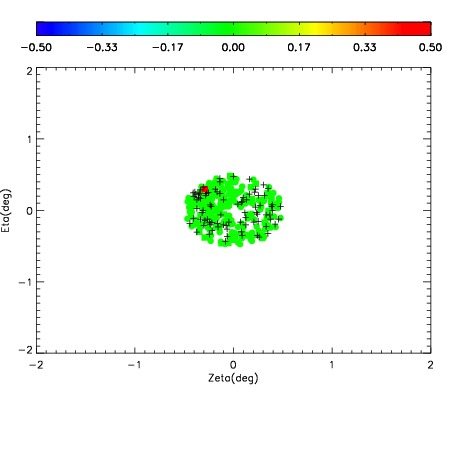
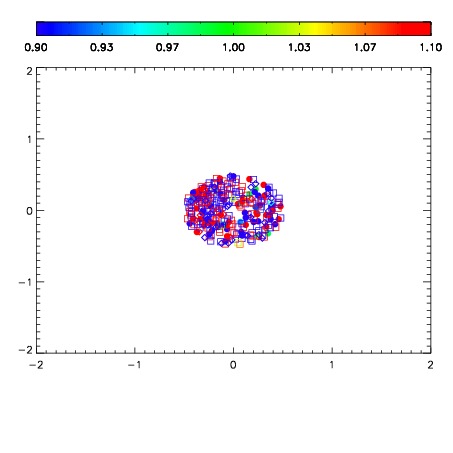


| Frame | Nreads | Zeropoints | Mag plots | Spatial mag deviation | Spatial sky 16325A emission deviations (filled: sky, open: star) | Spatial sky continuum emission | Spatial sky telluric CO2 absorption deviations (filled: H < 10) | |||||||||||||||||||||||
| 0 | 0 |
|
|
|
|
|
|
| 01650044 | 0.00000 | 210.421 |
| 01650045 | 0.00000 | 216.221 |
| 01650046 | 0.00000 | 230.143 |
| 01650047 | 0.00000 | 228.905 |
| 01650048 | 0.00000 | 217.503 |
| 01650049 | 0.00000 | 218.557 |
| 01650050 | 0.00000 | 224.322 |
| 01650051 | 0.00000 | 224.605 |
| 01650052 | 0.00000 | 222.917 |
| 01650053 | 0.00000 | 224.376 |
| 01650054 | 0.00000 | 213.508 |
| 01650055 | 0.00000 | 222.778 |
| 01650056 | 0.00000 | 224.411 |