| Red | Green | Blue | |
| z | 17.64 | ||
| znorm | Inf | ||
| sky | -NaN | -NaN | -Inf |
| S/N | 34.9 | 49.0 | 49.3 |
| S/N(c) | 0.0 | 0.0 | 0.0 |
| SN(E/C) |

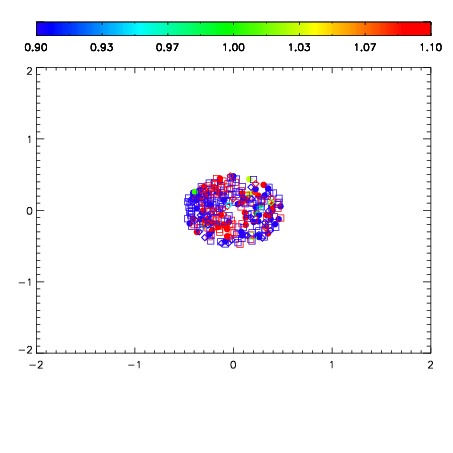
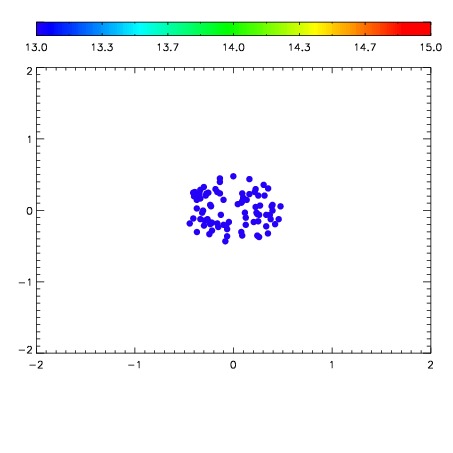

| Frame | Nreads | Zeropoints | Mag plots | Spatial mag deviation | Spatial sky 16325A emission deviations (filled: sky, open: star) | Spatial sky continuum emission | Spatial sky telluric CO2 absorption deviations (filled: H < 10) | |||||||||||||||||||||||
| 0 | 0 |
|
|
|
|
|
|
| IPAIR | NAME | SHIFT | NEWSHIFT | S/N | NAME | SHIFT | NEWSHIFT | S/N |
| 0 | 12750016 | 0.488656 | 0.00000 | 202.666 | 12750014 | 0.000292885 | 0.488363 | 203.521 |
| 1 | 12750012 | 0.486761 | 0.00189501 | 206.153 | 12750010 | 0.00000 | 0.488656 | 204.392 |
| 2 | 12750011 | 0.485838 | 0.00281802 | 200.131 | 12750013 | 0.000132717 | 0.488523 | 203.043 |
| 3 | 12750015 | 0.487756 | 0.000900000 | 192.684 | 12750017 | 0.000692153 | 0.487964 | 188.200 |