| Red | Green | Blue | |
| z | 17.64 | ||
| znorm | Inf | ||
| sky | -NaN | -NaN | -Inf |
| S/N | 30.0 | 42.9 | 41.8 |
| S/N(c) | 0.0 | 0.0 | 0.0 |
| SN(E/C) |


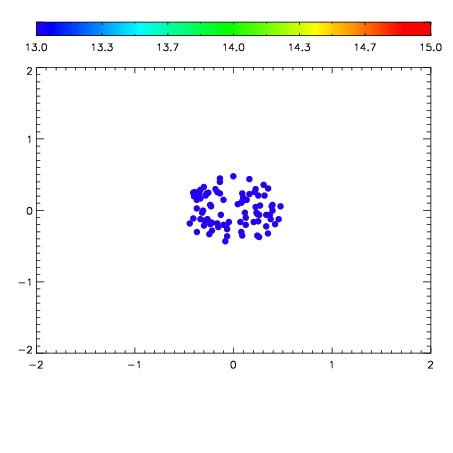

| Frame | Nreads | Zeropoints | Mag plots | Spatial mag deviation | Spatial sky 16325A emission deviations (filled: sky, open: star) | Spatial sky continuum emission | Spatial sky telluric CO2 absorption deviations (filled: H < 10) | |||||||||||||||||||||||
| 0 | 0 |
|
|
|
|
|
|
| IPAIR | NAME | SHIFT | NEWSHIFT | S/N | NAME | SHIFT | NEWSHIFT | S/N |
| 0 | 12880018 | 0.476237 | 0.00000 | 193.497 | 12880016 | 0.00000 | 0.476237 | 174.782 |
| 1 | 12880021 | 0.474074 | 0.00216299 | 198.121 | 12880019 | -1.49966e-05 | 0.476252 | 206.604 |
| 2 | 12880017 | 0.476049 | 0.000187993 | 193.531 | 12880020 | 0.000286826 | 0.475950 | 198.826 |
| 3 | 12880022 | 0.473782 | 0.00245500 | 181.601 | 12880023 | -0.00283536 | 0.479072 | 170.359 |