| Red | Green | Blue | |
| z | 17.64 | ||
| znorm | Inf | ||
| sky | -Inf | -Inf | -Inf |
| S/N | 54.8 | 79.6 | 83.6 |
| S/N(c) | 0.0 | 0.0 | 0.0 |
| SN(E/C) |
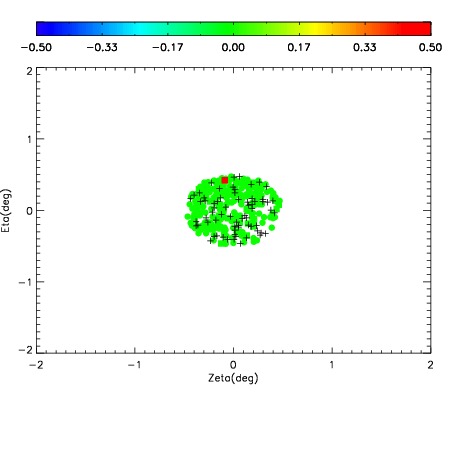
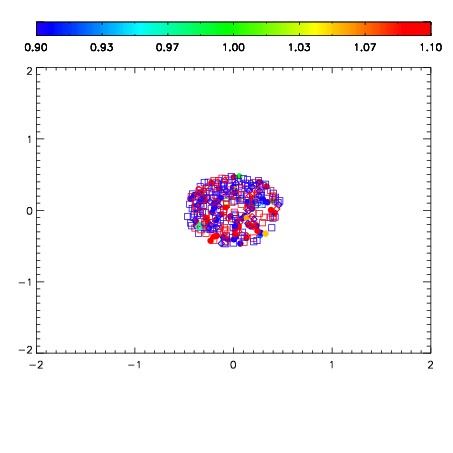
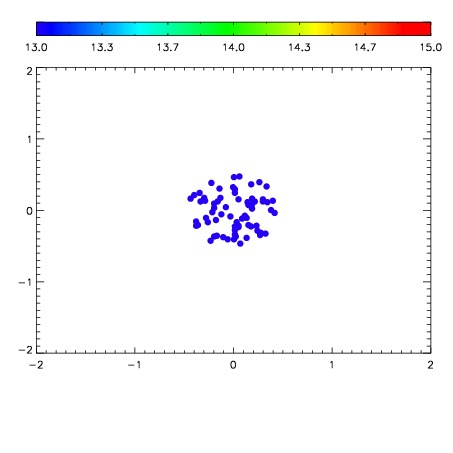

| Frame | Nreads | Zeropoints | Mag plots | Spatial mag deviation | Spatial sky 16325A emission deviations (filled: sky, open: star) | Spatial sky continuum emission | Spatial sky telluric CO2 absorption deviations (filled: H < 10) | |||||||||||||||||||||||
| 0 | 0 |
|
|
|
|
|
|
| 01630046 | 0.00000 | 238.210 |
| 01630047 | 0.00000 | 233.645 |
| 01630048 | 0.00000 | 238.846 |
| 01630049 | 0.00000 | 233.746 |
| 01630050 | 0.00000 | 236.703 |
| 01630051 | 0.00000 | 239.761 |
| 01630052 | 0.00000 | 236.773 |
| 01630053 | 0.00000 | 235.375 |
| 01630054 | 0.00000 | 236.536 |
| 01630055 | 0.00000 | 225.676 |
| 01630056 | 0.00000 | 218.181 |