| Red | Green | Blue | |
| z | 17.64 | ||
| znorm | Inf | ||
| sky | -NaN | -NaN | -Inf |
| S/N | 62.1 | 86.1 | 92.9 |
| S/N(c) | 0.0 | 0.0 | 0.0 |
| SN(E/C) |

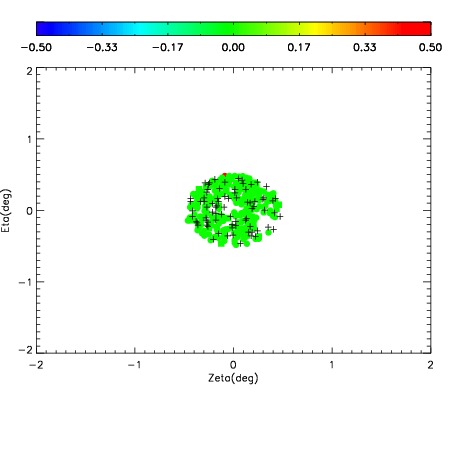
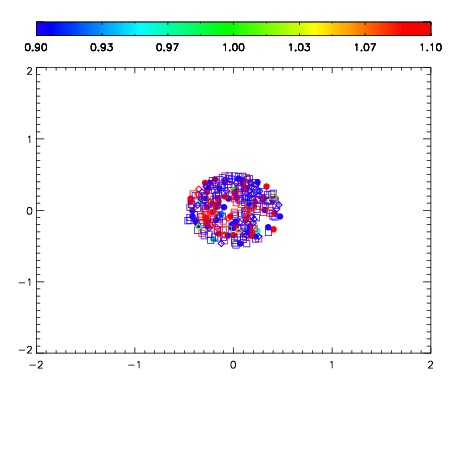
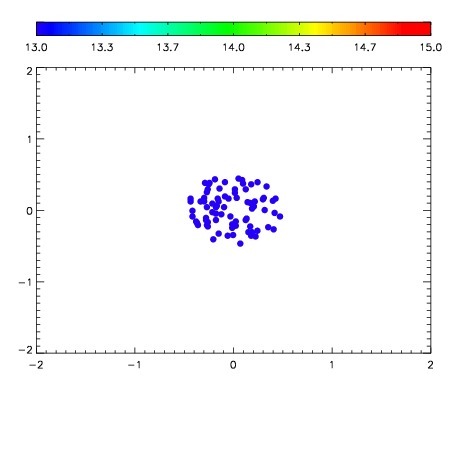

| Frame | Nreads | Zeropoints | Mag plots | Spatial mag deviation | Spatial sky 16325A emission deviations (filled: sky, open: star) | Spatial sky continuum emission | Spatial sky telluric CO2 absorption deviations (filled: H < 10) | |||||||||||||||||||||||
| 0 | 0 |
|
|
|
|
|
|
| 01620052 | 0.00000 | 153.804 |
| 01620053 | 0.00000 | 161.621 |
| 01620054 | 0.00000 | 163.234 |
| 01620055 | 0.00000 | 162.689 |
| 01620056 | 0.00000 | 164.407 |
| 01620057 | 0.00000 | 166.407 |
| 01620058 | 0.00000 | 163.122 |
| 01620059 | 0.00000 | 168.494 |
| 01620060 | 0.00000 | 168.046 |
| 01620061 | 0.00000 | 169.382 |
| 01620062 | 0.00000 | 166.937 |