| Frame | Nreads | Zeropoints | Mag plots
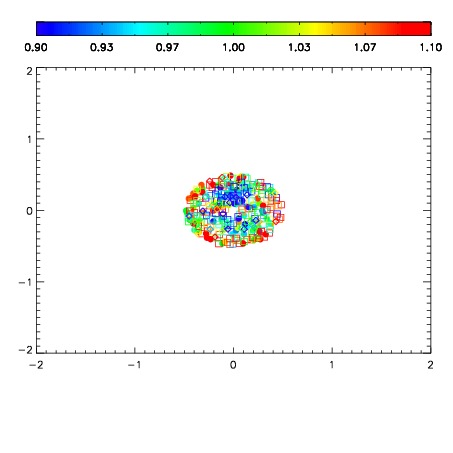
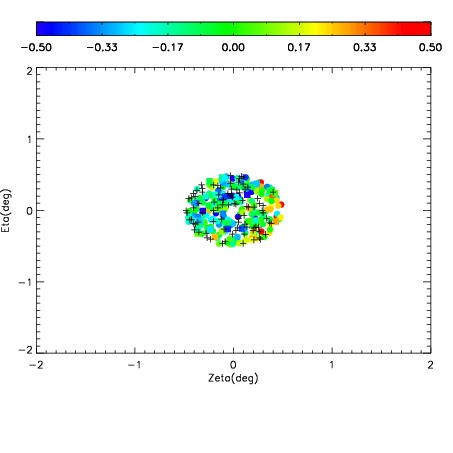
| Spatial mag deviation
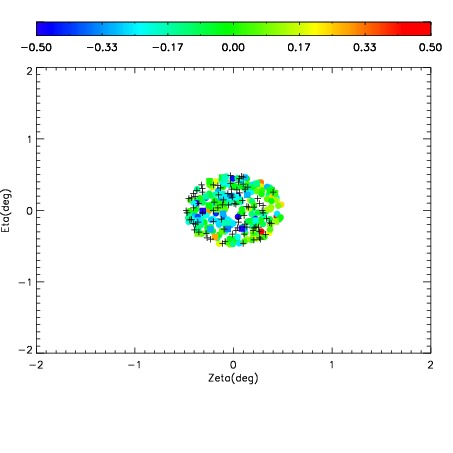
| Spatial sky 16325A emission deviations (filled: sky, open: star)
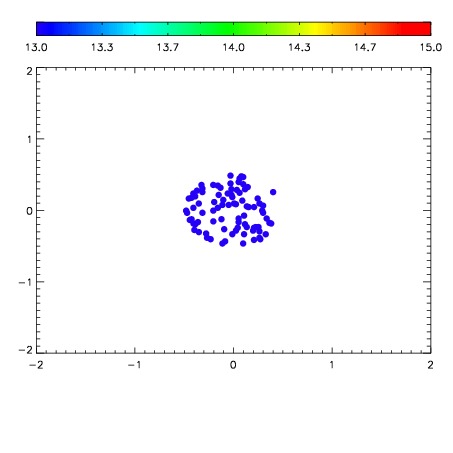
| Spatial sky continuum emission
| Spatial sky telluric CO2 absorption deviations (filled: H < 10)
|
| 1380085
| 25
| | Red | Green | Blue
| | z | | 17.76
| | znorm | | 14.27
| | sky | 12.2 | 12.0 | 11.8
| | S/N | 6.8 | 11.5 | 11.4
| | S/N(c) | 6.1 | 10.4 | 10.8
| | SN(E/C) 0.62
|
| 
| 
| 
| 
| 
|
| 1380086
| 25
| | Red | Green | Blue
| | z | | 17.72
| | znorm | | 14.23
| | sky | 12.2 | 12.1 | 12.0
| | S/N | 6.8 | 11.2 | 11.0
| | S/N(c) | 5.8 | 10.2 | 10.6
| | SN(E/C) 0.61
|
| 
| 
| 
| 
| 
|
| 1380087
| 25
| | Red | Green | Blue
| | z | | 17.35
| | znorm | | 13.85
| | sky | 11.6 | 11.6 | 11.4
| | S/N | 4.6 | 7.7 | 8.0
| | S/N(c) | 4.0 | 7.0 | 7.2
| | SN(E/C) 0.73
|
| 
| 
| 
| 
| 
|
| 1380088
| 25
| | Red | Green | Blue
| | z | | 17.08
| | znorm | | 13.59
| | sky | 11.4 | 11.3 | 11.2
| | S/N | 3.6 | 6.2 | 6.3
| | S/N(c) | 3.0 | 5.0 | 5.6
| | SN(E/C) 0.88
|
| 
| 
| 
| 
| 
|