| Red | Green | Blue | |
| z | 17.64 | ||
| znorm | Inf | ||
| sky | -NaN | -Inf | -Inf |
| S/N | 47.9 | 61.4 | 57.4 |
| S/N(c) | 0.0 | 0.0 | 0.0 |
| SN(E/C) |
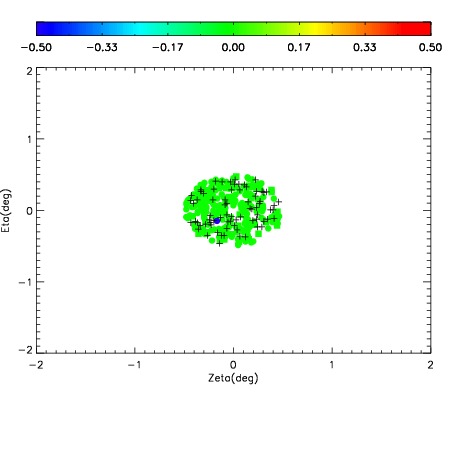
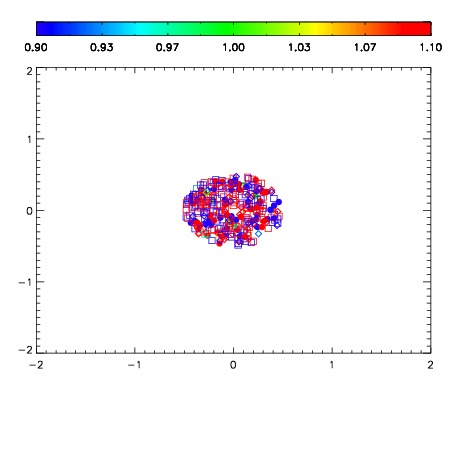
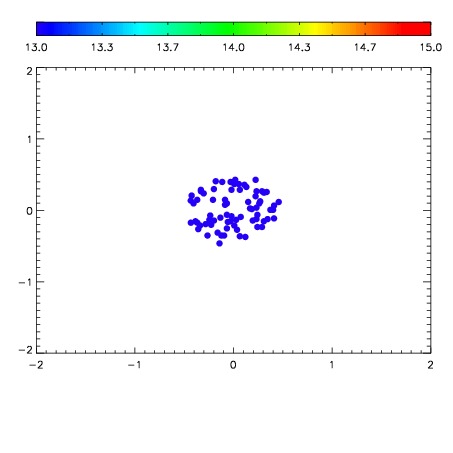

| Frame | Nreads | Zeropoints | Mag plots | Spatial mag deviation | Spatial sky 16325A emission deviations (filled: sky, open: star) | Spatial sky continuum emission | Spatial sky telluric CO2 absorption deviations (filled: H < 10) | |||||||||||||||||||||||
| 0 | 0 |
|
|
|
|
|
|
| 01420036 | 0.00000 | 168.638 |
| 01420037 | 0.00000 | 187.690 |
| 01420038 | 0.00000 | 192.743 |
| 01420039 | 0.00000 | 201.787 |
| 01420040 | 0.00000 | 207.070 |
| 01420041 | 0.00000 | 208.888 |
| 01420042 | 0.00000 | 210.383 |
| 01420043 | 0.00000 | 214.081 |
| 01420044 | 0.00000 | 205.755 |
| 01420045 | 0.00000 | 211.098 |