| Red | Green | Blue | |
| z | 17.64 | ||
| znorm | Inf | ||
| sky | -NaN | -Inf | -Inf |
| S/N | 29.5 | 50.0 | 63.7 |
| S/N(c) | 0.0 | 0.0 | 0.0 |
| SN(E/C) |
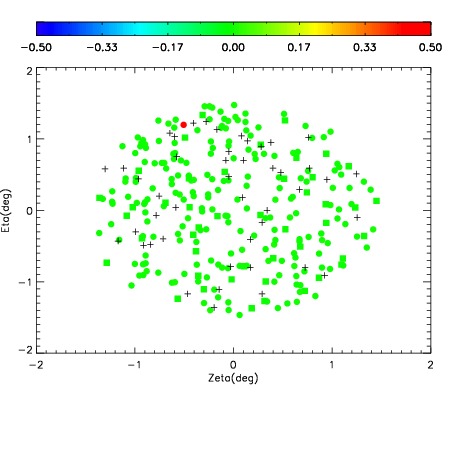

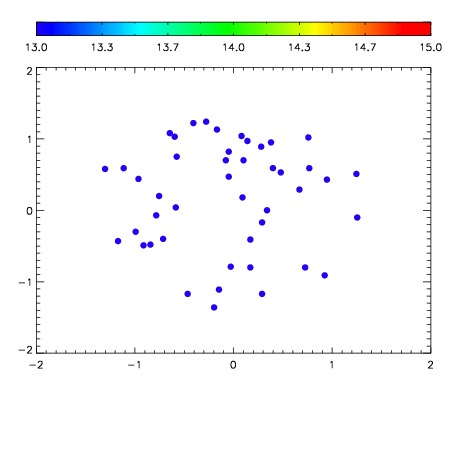

| Frame | Nreads | Zeropoints | Mag plots | Spatial mag deviation | Spatial sky 16325A emission deviations (filled: sky, open: star) | Spatial sky continuum emission | Spatial sky telluric CO2 absorption deviations (filled: H < 10) | |||||||||||||||||||||||
| 0 | 0 |
|
|
|
|
|
|
| 01730019 | 0.00000 | 205.930 |
| 01730020 | 0.00000 | 204.025 |
| 01730021 | 0.00000 | 201.287 |
| 01730022 | 0.00000 | 199.372 |
| 01730023 | 0.00000 | 193.338 |
| 01730024 | 0.00000 | 194.149 |
| 01730025 | 0.00000 | 193.711 |
| 01730026 | 0.00000 | 195.750 |